Goal
Before a rack of servers is switched on, someone has to know which power cable goes into which outlet, how much current each circuit will carry, and what happens when one of the two power feeds goes away. Getting it wrong means a tripped breaker, or a rack that takes down both sides of its redundancy at once.
This post is a worked example. We define a rack, write down an assumption for every number, and use a short script to do the arithmetic and check it. The second half goes behind the rack: the electrical chain from the transformer to the rack PDU in a data center, and the questions each part of it answers.
Terms used in this post
- PDU: a power distribution unit, a strip or box with many outlets that feeds a rack from one circuit.
- Feed: one power source for the rack. Racks with two feeds, A and B, can lose one and keep running.
- Redundant power supply: a server with two power supplies, one plugged into each feed.
- Breaker: the switch that opens when current is too high. A PDU has one for its input and often one per bank of outlets.
- Continuous limit: the current a circuit may carry for hours. A common rule is 80 percent of the breaker rating.
- Bank: a group of outlets on a PDU that share a branch breaker.
- Startup draw: the extra power a machine uses for the first minute, while fans spin at full speed and the machine starts up.
- Staged power-on: switching machines on in groups with a delay between them, so the startup draws do not stack.
- Power capping: limiting how much power a machine may use, for example on a GPU with a software setting.
- Transformer secondary: the low-voltage side of the transformer that steps the utility’s medium voltage down for the building, commonly 480Y/277 V in North America and 415Y/240 V elsewhere.
- Switchgear: the enclosures of large breakers that receive power from the transformer and split it into feeders, with protection and metering.
- UPS: an uninterruptible power supply, a battery-backed unit that keeps the load running through an outage until generators start.
- STS: a static transfer switch, a fast electronic switch that moves a load between two sources.
- RPP: a remote power panel, a panel near the racks with the breakers for their circuits.
- Busway: an overhead rail that carries power along a row, with plug-in boxes where racks tap off.
- N, N+1, 2N: redundancy levels. N is exactly enough equipment, N+1 adds one spare, and 2N is two complete independent systems.
- Fault current: the very large current that flows in a short circuit, which every breaker and busbar has to withstand and interrupt.
- Selective coordination: choosing breaker settings so that only the breaker closest to a fault opens.
- Arc flash: the energy released by an electrical arc, which sets the protective equipment needed to work near live gear.
What I built
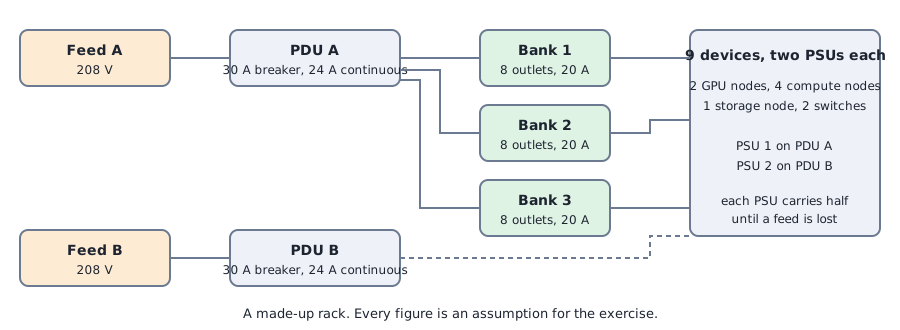
- An example rack. Two GPU nodes, four compute nodes, one storage node, a top-of-rack switch and a management switch, nine devices in all. Each has two power supplies.
- A script.
powerplan.pybuilds the outlet map, checks the circuits with both feeds up and with one feed lost, compares some options, and checks a staged power-on step by step. - A second script.
elec.pyworks out rack PDU capacity by type, fault current, voltage drop, the availability of redundancy models and a synchronized GPU load step, using textbook formulas and assumed inputs. - Two diagrams and six result images. One diagram is the rack’s two feeds, the other a single-line sketch of a 2N chain from the utility to the rack.
The numbers are my assumptions: 208 volts, a 30 amp PDU breaker with an 80 percent continuous limit, a power factor of 0.95, 20 amp branch breakers on three banks of eight outlets, and a typical, peak and startup wattage for each kind of device. A real plan would take these from the data sheets and from measurement.
How it works
Every device has two power supplies. The first goes on PDU A and the second on PDU B, and while both feeds are up each supply carries half the load. If a feed is lost, the other PDU has to carry the whole rack, so the useful check is the load on one PDU with everything at peak, not the share when both are up.
The script places devices across the three banks so that the two GPU nodes land on different banks, then adds up the peak watts per bank and per PDU and converts them to amps. It compares each with the continuous limit and not with the breaker rating, because a circuit that sits at 100 percent of its breaker for hours is already over the rule.
For power-on, it assumes the worst case, which is only one feed available. It switches devices on in a fixed order with 30 seconds between steps: network, storage, compute two at a time, then the GPU nodes one at a time. At each step it adds the startup draw of the new devices to the typical draw of the ones already running, and checks the total against the limit.
The electrical chain behind the rack
The first half of this post stops at the outlet. A real data center has a long chain behind it, and each link exists to answer one question. This section walks the first part of it in order, and the results below put numbers on it. The redundancy models, protection studies, grounding, power quality, monitoring and commissioning are in the appendix at the end. It is textbook material applied to an example site, not a design.
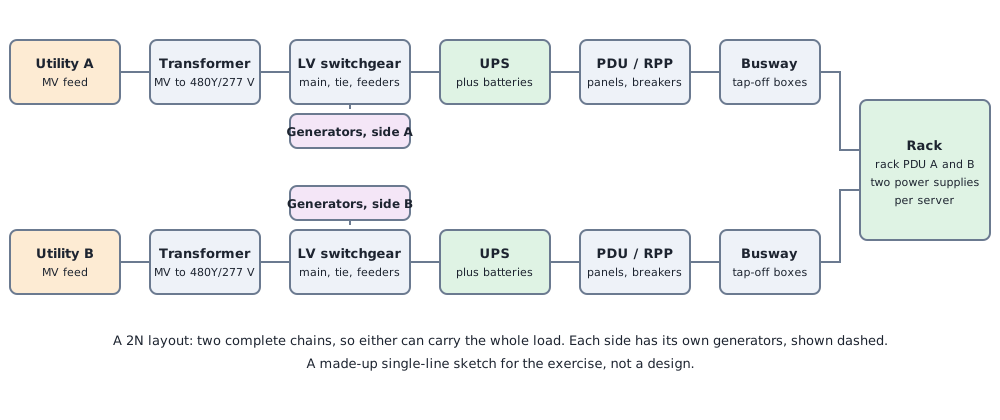
Transformer and low-voltage switchgear. Utility medium voltage comes into the site and a transformer steps it down. The secondary is typically 480Y/277 V in North America and 415Y/240 V in much of the rest of the world, and everything below that point is the low-voltage system. The transformer feeds switchgear: large breakers arranged as a main, often a tie between two sides, and feeders. Generators connect here, on the same side as the utility they back up.
UPS. The UPS sits between the switchgear and the load. In the common double-conversion design, a rectifier turns the incoming AC into DC, a battery is held on the DC bus, and an inverter makes clean AC again, so the load does not see the utility at all and nothing is lost when the utility drops. A static bypass lets the UPS pass the load straight through if the inverter fails. Static transfer switches can move a load between two sources in a fraction of a cycle, which is how some designs let one source feed a load when its main source fails.
Distribution, busway and the rack. From the UPS output, power goes through distribution boards, PDUs or remote power panels, then either cables or overhead busway to the row, where each rack taps off through a box with its own breaker, then a rack PDU. The rack PDU in my exercise was single-phase 208 V. Real high-density racks use three-phase rack PDUs, which carry much more through the same plug.
Voltage choice. The same current carries more power at higher voltage and three-phase, and the next section shows it. Many North American sites step 480 V down to 208Y/120 V in a PDU transformer, which costs a stage of losses and a piece of equipment. With 415Y/240 V, the line-to-neutral voltage of 240 V is within what server power supplies accept, so racks can be fed directly with no step-down transformer. Higher densities push this further, and proposals for 400 V and 800 V DC distribution to the rack are being discussed for the largest GPU racks. I have only read about those.
Commands and results
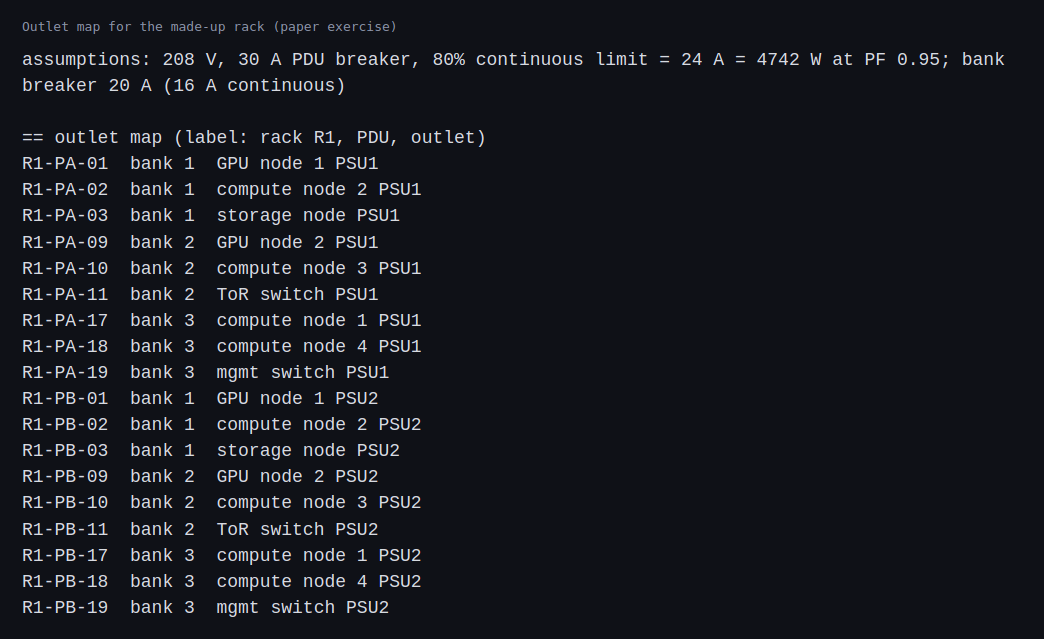
Here is the outlet map. The labels follow the pattern rack, PDU, outlet number, so that the label on a cable tells you where it goes.
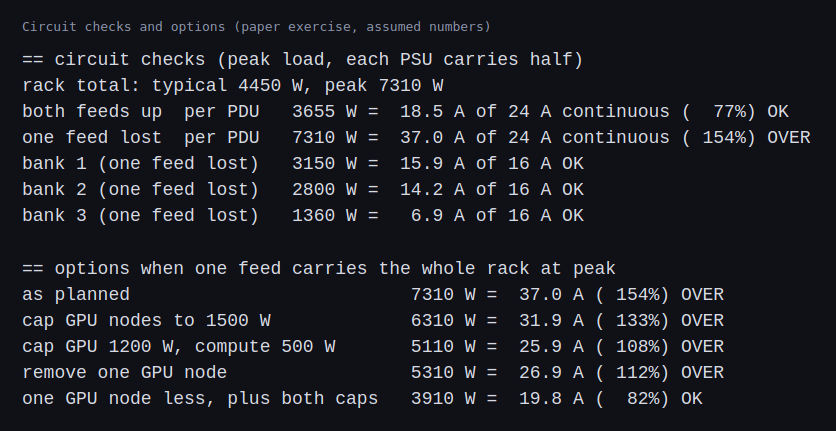
The circuit checks are the interesting part. With both feeds up each PDU carries 3,655 watts at peak, which is 18.5 amps and 77 percent of the continuous limit. That passes. With one feed lost, the other PDU would carry 7,310 watts, which is 37 amps against a 24 amp continuous limit, 154 percent. The rack as I designed it cannot ride through losing a feed at peak load. Capping the GPU nodes to 1,500 watts, capping the compute nodes as well, or removing a GPU node each helped but none was enough alone. Only removing one GPU node and capping both kinds of node got one feed under the limit, at 82 percent.
The banks passed, but bank 1 reached 15.9 amps against a 16 amp continuous limit when one feed was lost, which is too close to trust.
The staged power-on on one 30 amp feed went through the network, storage and compute steps with room to spare. The first GPU node started at 90 percent of the limit. The second would have taken it to 115 percent, so on a single feed the last GPU node cannot be started until something else is switched off. With 50 amp PDUs, the same plan passes every check: 92 percent of the limit with one feed lost at peak, and 69 percent at the worst power-on step.
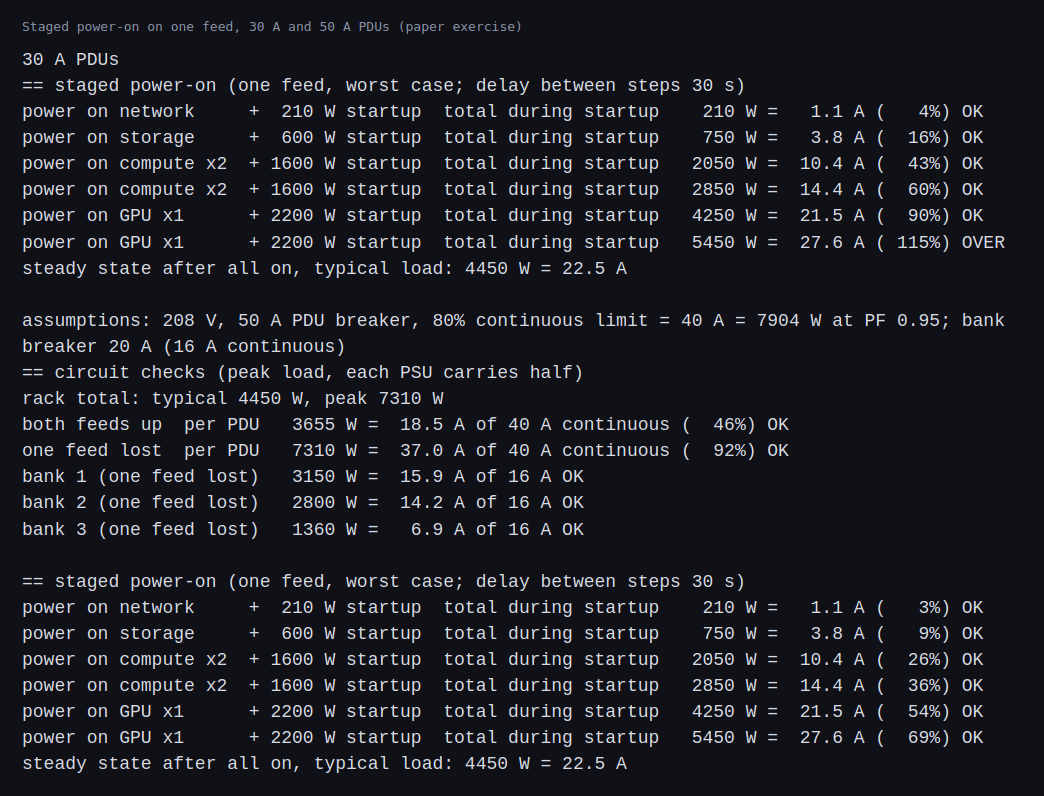
None of these figures is a measurement. They are the result of the assumptions I wrote down, and a change in one of them, such as a higher startup draw, would change the answer.
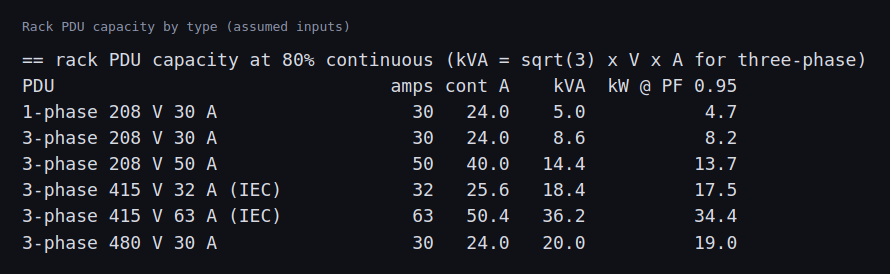
The second script covers the chain behind the rack. First, what a rack can carry depends heavily on the kind of PDU. The 208 V single-phase 30 A unit I used above delivers about 5.0 kVA at the 80 percent limit. A three-phase 208 V 30 A unit delivers 8.6 kVA, and a three-phase 415 V 32 A unit 18.4 kVA. Moving up the voltage and phases is how a rack gets to tens of kilowatts without a larger plug.
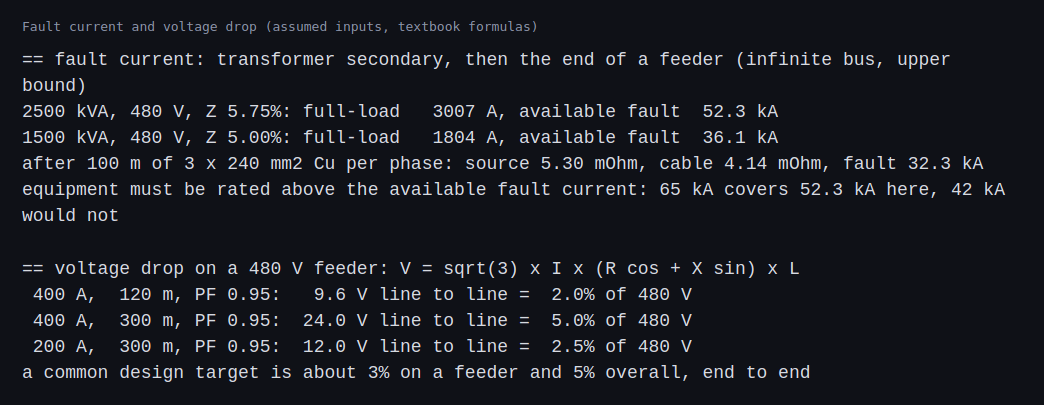
Second, fault current and voltage drop. A 2,500 kVA transformer at 480 V with 5.75 percent impedance has a full-load current of 3,007 A and, on an ideal source, an available fault current of 52.3 kA. That is the number every breaker at the board must be rated above. With 100 m of three parallel 240 mm2 copper conductors per phase, the available fault current at the far end drops to 32.3 kA, because the cable adds impedance. The voltage drop for 400 A over 120 m comes to 2.0 percent, but over 300 m it reaches 5.0 percent, which is the whole budget for the system in one feeder.
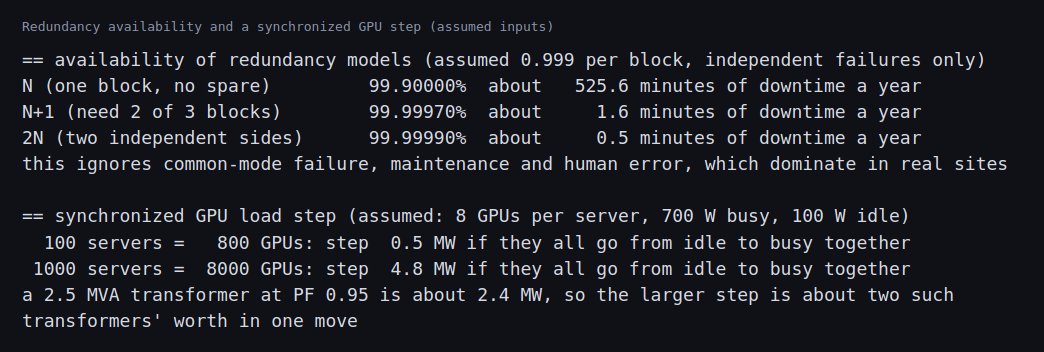
Third, redundancy and the GPU step. With an assumed 0.999 availability per block and independent failures, one block with no spare gives about 525 minutes of downtime a year, N+1 about 1.6 minutes and 2N about 0.5. The model ignores common-mode failures, maintenance and mistakes, which dominate in practice, so the gap between the models is real but the absolute numbers are not predictions. A synchronized change of 8,000 GPUs from 100 W to 700 W is a 4.8 MW step, about two 2.5 MVA transformers’ worth.
Everything above comes from assumptions and textbook formulas, and not from a study or a meter.
Challenges
- Redundant supplies do not mean redundant circuits. Every device here has two power supplies, which looks redundant, but the circuits behind them were sized for the shared load and not for the loss of a feed. The two designs need different checks, and only the second one failed.
- One bank is nearly full. A bank can be fine on average and still be the weak point when a feed is lost, because its devices then draw twice as much from it. Moving devices between banks matters as much as the PDU size.
- The recovery path can be the one that does not fit. The power-on sequence worked for most devices and failed on the last and largest one. A plan for losing a feed also needs a plan for bringing the rack back with only one feed.
- Fault current falls along the feeder, and so does the margin of a wrong guess. The 52.3 kA at the transformer became 32.3 kA after one feeder. Equipment at each point needs its own rating, and a design that uses the transformer number everywhere overspends, while one that uses a distant number underprotects.
- A long feeder uses the whole voltage-drop budget. The same 400 A feeder was fine at 120 m and consumed the full 5 percent at 300 m. Placement of the equipment is an electrical decision.
- The load is not steady. The size of a synchronized GPU step, 4.8 MW for 8,000 GPUs on my assumptions, means capacity checks on average draw are not enough. The ramp rate matters as much as the level.
- The options are trade-offs and not fixes. Capping GPU power gives up performance, and removing a node gives up capacity. Larger PDUs cost more and need a bigger circuit in the room. Someone has to choose.
Differences with a production setup
- Measurements. A real plan uses the data sheet and measured draw of each model, a metered PDU, and a margin for aging fans and hot days. I used round numbers.
- Standards and rules. Electrical rules differ by country and building, and an electrician signs off on the circuits. The 80 percent rule here is the common one, not a legal opinion.
- Three-phase power. Larger racks use three-phase feeds, which change the arithmetic. The Open Compute Project publishes rack and power designs for dense racks.
- Metering and capping. Production racks use PDUs with per-outlet metering, and GPU power limits are set with nvidia-smi or by the BMC.
- Inrush. Switching on a power supply draws a short spike far above its running current. I modeled startup draw over a minute, not the spike, which depends on the breaker type and the supply.
- Studies. A real design needs load-flow, short-circuit, coordination, arc-flash and voltage-drop studies in software such as ETAP, SKM or EasyPower, stamped by an engineer. I used textbook formulas for single points.
- Safety standards. Work near energized equipment follows NFPA 70E, and acceptance testing of switchgear follows the NETA specifications.
- Site classification. The Uptime Institute tier system describes the redundancy of whole sites.
- Cooling and floor load. Power turns into heat, and a rack also has to be cooled and carried by the floor. Neither is in this exercise.
FAQ
Why check the loss of a feed and not the normal case?
The normal case is the easy one. Redundancy exists for the failure case, so that is the load the circuits have to be sized for.
Why use 80 percent of the breaker rating?
A breaker is meant to protect the wiring, and a continuous load near its rating heats the breaker and the wires. The common rule is to keep long-running loads to 80 percent.
Why stage the power-on?
Machines draw more than their typical power at startup, with fans at full speed. Switching everything on together stacks those draws and can trip a breaker that would carry the running load without trouble.
What is the difference between typical, peak and startup power here?
Typical is what a machine uses in normal work, peak is the most it can use under full load, and startup is the higher draw for the first minute. I made all three up for the exercise.
Why would a site use 415 V and not 208 V to the rack?
At 415Y/240 V, each phase to neutral is 240 V, which server power supplies accept, so no step-down transformer is needed. A given current also carries more power, so the same conductors feed more kilowatts and there is one less stage of losses.
Why is 2N more expensive than N+1?
Two full chains mean each is sized for all of the load and runs at half or less in normal operation. N+1 buys one spare unit. 2N survives any single failure along the whole chain, while N+1 usually still shares some path.
Why does available fault current matter?
A breaker must be able to open a fault without destroying itself, so its interrupting rating has to exceed the fault current at its location. Too low a rating is a safety problem and not a performance one.
What is the difference between short-circuit, coordination and arc-flash studies?
Short-circuit studies calculate how much current a fault can produce. Coordination studies set breakers so that only the nearest one opens. Arc-flash studies use the fault current and clearing time to find the energy released at the equipment, which sets the safety requirements. They are done in that order.
What will change the most between this example rack and a real one?
The numbers. A real rack has a measured draw for each server and circuit, so the headroom on every circuit will move, and the inputs to the check script are the first thing to replace.
Repeating with real hardware
Coming soon. When I have real servers and a metered PDU, I will measure the actual typical, peak and startup draw of each machine, replace my assumed numbers with them, and run the same checks, including a real power-on sequence with the load watched on the PDU. The data center electrical chain has no hardware version at home scale, so there the repeat would be a model in study software, not equipment.
Next
Take the quiz to test your understanding: Part 6 quiz
Part 6 continues with checks on the VMs that already exist, starting with drift detection.
A note on what comes later
This post is more detailed than the usual series. I come from an electrical background and I am moving toward infrastructure for AI. I am writing a separate series on electrical design for data centers, which starts with redundancy architectures and short-circuit current and coordination. The plan covers: single-line diagrams and redundancy architectures, short-circuit, coordination and arc-flash methods, UPS topologies and batteries, grounding and power quality, busway and rack distribution at 415 V and 480 V, GPU load behavior and transients, 400 V and 800 V DC, metering and monitoring, and commissioning documents. They are paper and software exercises on an example site, and each says what was calculated and what was not.
Appendix: the electrical chain in more detail
These notes go deeper than the main post needs. They are textbook material about an example site, written for reference.
Redundancy models
- N is exactly enough equipment. Any failure or maintenance outage is a load outage.
- N+1 adds one spare unit. It survives one failure but the systems usually share a common path somewhere.
- 2N is two complete independent chains, each able to carry the whole load. Either can fail or be maintained. The cost is that each side is sized for 100 percent, so in normal operation each runs at no more than 50 percent. My rack in this post behaves this way, which is why losing a feed doubled the load on the other.
- Distributed redundancy spreads spare capacity across several blocks, for example three blocks where each load is fed by two of them, so each block can run at about 66 percent while any one block can fail. It uses equipment better and is harder to design, operate and keep balanced.
- A catcher design has several primary blocks, each carrying load, plus a reserve block, the catcher, that normally carries nothing and takes over the load of any failed primary through transfer switches.
- Uptime Institute tiers describe the same ideas for whole sites: Tier III means concurrently maintainable, so any component can be taken out for maintenance without a load outage, and Tier IV means fault tolerant, so a single fault does not cause one.
Short circuits, coordination and arc flash
A short circuit near a transformer can draw tens of thousands of amps. Every breaker and bus must be rated to interrupt more than the fault current available where it sits, so the first study for any distribution design is a short-circuit study. Selective coordination is the second: the breakers in series have to be set so that a fault in a rack circuit opens only the rack circuit breaker, not the one feeding the whole row. Some parts of the NEC require selective coordination for emergency and similar systems. The third is arc flash: the energy a fault can release at a piece of equipment sets the labels, the protective clothing and the rules for working near live gear, under the NFPA 70E safety standard and the IEEE 1584 calculation method. These studies are done in software such as ETAP, SKM or EasyPower, with a model of the real equipment. The fault-current arithmetic in the results above is only the textbook first step.
Grounding
In a North American system, a solidly grounded wye transformer secondary has its neutral bonded to ground at one point, the source, and equipment is bonded to ground throughout. Where a transfer switch joins two sources, the choice between three-pole and four-pole switching decides whether the neutral is also switched, which affects where the neutral and ground are bonded. Some industrial and critical systems use high-resistance grounding so that a first ground fault does not trip anything. Racks are bonded to the building ground, and the grounding of the equipment room also matters for sensitive signal paths. The IEEE color book on grounding goes deep on this and I have not worked through it.
Power quality and GPU loads
Modern server power supplies correct their power factor, so at load the draw looks close to resistive. Larger sources of harmonics are rectifiers in older UPS designs, which is one reason newer ones use active front ends. In 208Y/120 V systems with many single-phase loads, third-harmonic currents add in the neutral. GPU clusters add a different problem: a training job can drive thousands of GPUs from idle to full power and back together, on a timescale of a second or less. The results above show that the step alone can equal the size of two transformers. A step like that tests the UPS, the generator and the utility connection, and it can excite oscillations. The usual levers are limits on how fast a GPU may change power, software power caps, energy storage on the rack or in the UPS, and scheduling that staggers jobs. Simulating this properly needs electromagnetic transient tools such as PSCAD. I did the arithmetic and nothing more.
Monitoring
Meters belong at every level: switchgear, UPS, distribution boards, busway taps and rack PDU outlets. They feed capacity planning and alarms. The idea of stranded power matters here: capacity that exists on paper but cannot be used because a circuit, a bank or a phase is full while others are empty. Power usage effectiveness (PUE) is the total facility energy divided by the energy used by the IT equipment.
Commissioning and standards
Equipment is witnessed in the factory, inspected on delivery, started up, tested piece by piece against its sequence of operations, and then tested together under load, commonly with load banks standing in for servers, in an integrated systems test that includes pulling a source on purpose. The NETA acceptance testing specification covers the electrical tests on switchgear and breakers. The NEC, in particular Article 645 on information technology equipment rooms, and NFPA 70E apply, along with the IEEE standards for protection, coordination and grounding.
Comments