Goal
The earlier posts in this series followed the power from the generators and the grid connection to the substation that feeds the site. This post enters the hall. The Part 6 power plan followed one rack back to the transformer. Here we step back to the whole room and asks how the power blocks behind it are arranged, and what each arrangement costs in installed capacity and survives when something fails.
Terms used in this post
- Single-line diagram: a drawing where one line stands for all three phases of a circuit, so a whole power system fits on a page. Boxes and symbols stand for sources, transformers, breakers, buses, UPS units and loads.
- UPS block: a UPS system with its batteries, input and output switchgear, and the transformer and generator capacity behind it, treated here as one unit with a kW rating.
- STS: a static transfer switch, which moves a load between two sources in a fraction of a cycle.
- Dual-corded: a rack or server with two power cords, each fed from a different source, so either can carry it alone.
- N: exactly the number of blocks needed to carry the load.
- N+1: N units plus one spare. The unit can be a UPS module inside one UPS system or a whole power block.
- 2N: two complete systems, each able to carry the whole load.
- Distributed redundant: several blocks where each load is fed by two of them and the spare capacity is spread across all blocks.
- Catcher: several primary blocks that carry load, plus one reserve block that carries nothing until a primary fails.
- Concurrently maintainable: any single component can be taken out for maintenance without shutting down the load.
- Common-mode failure: one cause that takes out parts that were supposed to be independent, such as a shared bus, a shared fuel supply or the same mistake made twice.
What I built
- An example hall with 2,400 kW of critical load, all dual-corded. The number is an assumption.
- A single-line-style sketch of three designs for it: 2N, distributed redundant (three blocks make two) and catcher (three primaries and a spare).
- A fourth design as a baseline: N+1 parallel UPS modules on one shared output bus. It sits one level below the other three, inside a single UPS system instead of across whole power blocks.
bmc/sld.py, a script that sizes each design, checks the busiest block with one block out, counts what is left with two blocks out, and checks a distributed design whose load pairs are not equal.bmc/sld_cost.py, a mock model that gives each design an availability figure from assumed failure and repair times, a cost breakdown by equipment class, and the price of each minute of downtime avoided. Every cost and failure input in it is an assumption and is listed in the post.
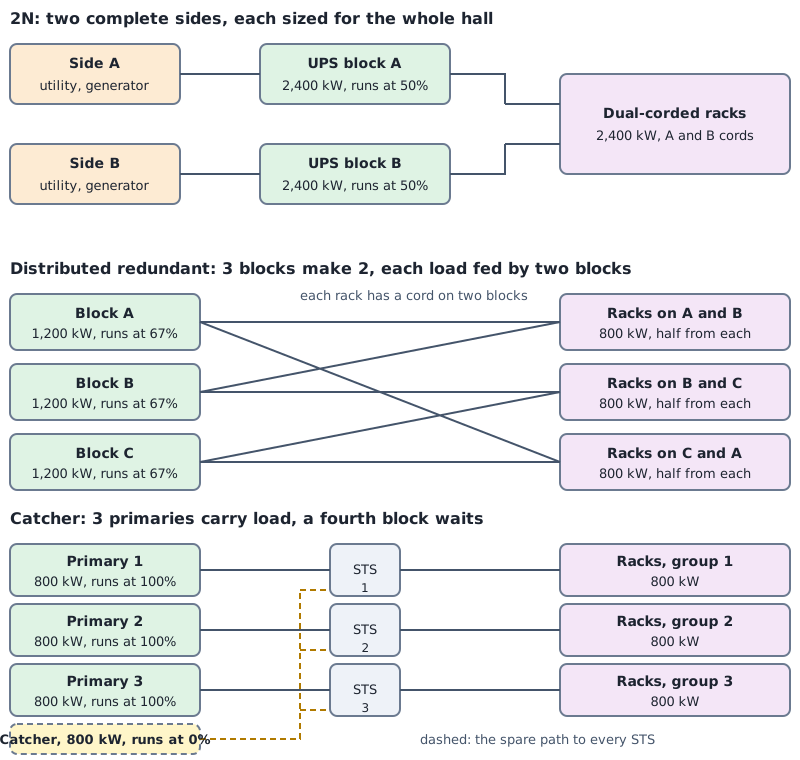
The sketch is block level. A full single-line diagram would also show breaker ratings, cable sizes, transformer data, generators, meters and bus ties. I left those out because the question here is how the blocks are arranged, not how each one is built.
How it works
Each design is a rule for how load moves when a block is lost. The script applies the rule and divides by the block rating.
Two levels of redundancy. The first design below is N+1 inside one UPS system: the unit that is duplicated is a 600 kW UPS module, and the bus, breaker, switchgear and utility feed around it are shared. The other three are redundancy between whole power blocks, where a block is a UPS system with its own switchgear, utility feed and generator behind it. N+1 is a rule that works at either level. At block level the catcher is N+1, three primaries and one reserve, and distributed redundant is N+1 too, three blocks for a load that needs two, with the spare capacity spread over all of them instead of held in one. Only 2N is not N+1, because it duplicates everything. The module-level design is here as the baseline most single UPS rooms follow, and it shows how much of the other designs’ resilience comes from separate paths and not from the count of units.
N+1 on one bus, at module level. Five 600 kW modules share one output bus. Normal load is 480 kW per module, 80 percent. Losing a module puts 600 kW on each of the other four, which is 100 percent. It is the cheapest per kW. Every rack depends on the one output bus and its breaker, so it is not a design with two paths.

The drawing shows N+1 at the module level, inside one UPS system, which the block-level sketch above leaves out. All the modules feed one bus, so a module failure is covered by the others and a bus failure is not covered at all. The three block-level designs below remove that single point by giving the racks more than one path to the blocks.
2N. Two sides, each a full 2,400 kW block, each with its own utility feed and generator. Every rack has a cord on each side. In normal operation each side carries half, 50 percent. Losing one side moves the whole hall onto the other at 100 percent. It is also the design where a rack cord can be traced end to end on its own path, which makes it the easiest to reason about.
Distributed redundant, three blocks make two. Three 1,200 kW blocks. The racks are split into three groups, each fed by a different pair of blocks, so the group on A and B draws half from each. Each block runs at 800 kW, 67 percent. If A fails, its half of the AB group moves to B and its half of the CA group moves to C. Each survivor goes from 800 kW to 1,200 kW, exactly full. With n blocks and equal pairing the loading limit is (n-1)/n, so four blocks allow 75 percent and six allow 83 percent.
Catcher. Three 800 kW primaries each carry a group of racks at 100 percent. A fourth 800 kW block carries nothing. A transfer switch in front of each group can move that group to the catcher. If a primary fails, the catcher takes its 800 kW and is then full. The block count is n+1 and the utilization is n/(n+1), 75 percent here.
The first results table is capacity: what each design installs for 2,400 kW of load and how loaded each block is in normal operation. The second is the busiest block with one block out. The third counts how much capacity is left with two blocks out. The last is the check on unequal pairs in the distributed design.
Commands and results
python3 bmc/sld.py size one
python3 bmc/sld.py two
python3 bmc/sld.py imb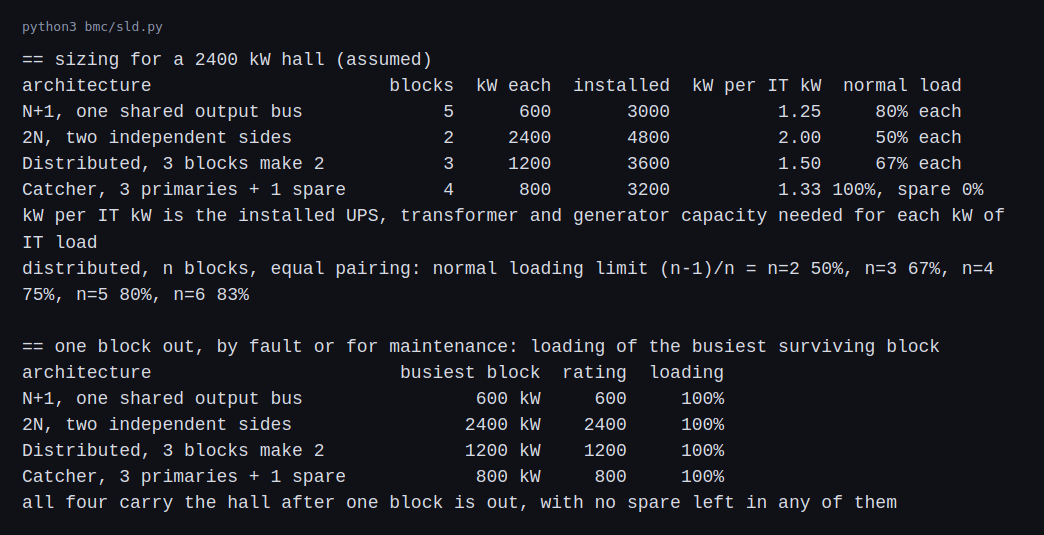
2N installs 4,800 kW for 2,400 kW of load, 2.00 kW for each kW of IT. Distributed redundant installs 3,600 kW (1.50), the catcher 3,200 kW (1.33) and the shared-bus N+1 3,000 kW (1.25). With one block out, the busiest surviving block is at 100 percent in all four. None of them has margin left after the first loss.
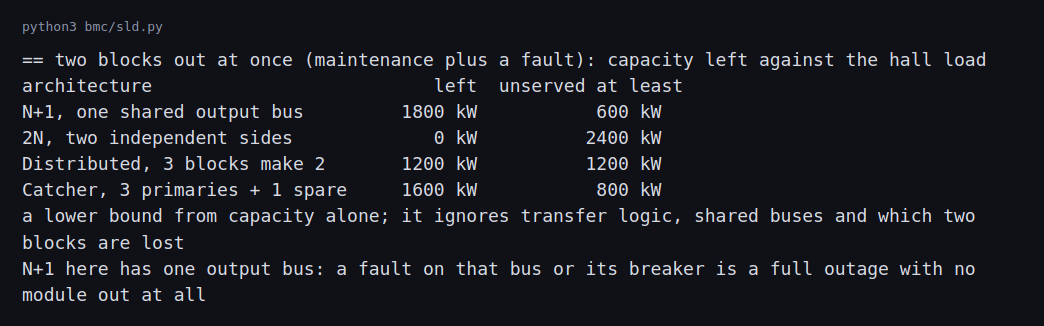
With two blocks out, the lower bound on unserved load is 600 kW for the shared-bus N+1, 800 kW for the catcher, 1,200 kW for the distributed design and 2,400 kW for 2N (both sides lost). This only counts capacity. It ignores which two blocks are lost and how the transfer logic behaves. It also shows that two overlapping events, such as a maintenance outage and a fault, are beyond what any of these designs covers.
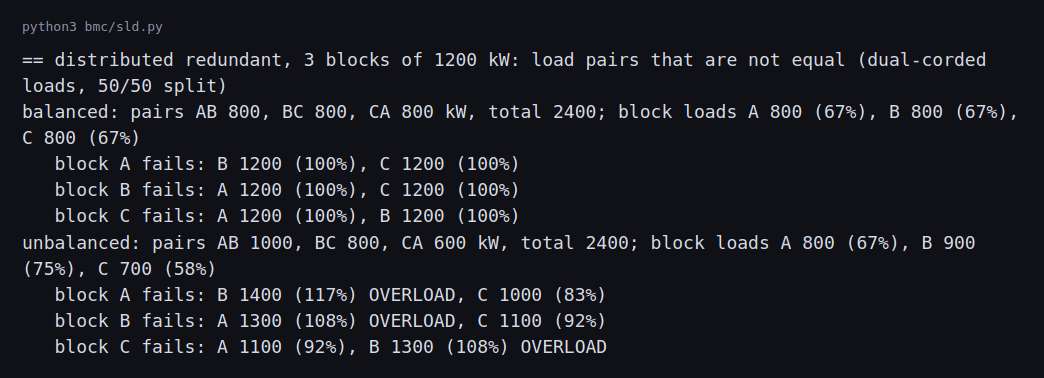
With equal pairs of 800 kW, every failure case ends at exactly 1,200 kW per survivor. When I moved to pairs of 1,000, 800 and 600 kW, with the same 2,400 kW total, the normal loading was 67, 75 and 58 percent, and no block was near its limit. Losing block A put B at 117 percent. Losing B put A at 108 percent. Losing C put B at 108 percent. Three failure cases out of three left a survivor over its rating, in a hall that looked comfortable until a block was lost.
Reliability and cost targets
A design is chosen against a target, so the question is what each design buys and what it costs. This section puts numbers on both for the example hall. They come from a script with stated assumptions, not from vendor quotes or measured failure data, and the point is the shape of the comparison.
Reliability target. The target is stated as availability, or as minutes of outage a year. 99.99 percent is 52.6 minutes a year. 99.999 percent is 5.3 minutes. The Uptime Institute tiers are a design classification and not an availability promise, so the target should be written in the contract as a number, a definition of what counts as an outage, and the load it applies to.
Assumptions in bmc/sld_cost.py.
- Each block’s whole path (utility, generator, UPS, switchgear) has one forced outage a year (MTBF 8,760 h) and takes 4 hours to restore. That gives a block availability of 99.954 percent.
- A fraction of every block’s outages, 2 percent, is a common-mode event that hits all blocks together: the same firmware, the same commissioning error, a shared fuel supply.
- Load is lost when fewer than the needed number of blocks are up: one of two for 2N, two of three for distributed, three of four for the catcher. The catcher’s transfer switch fails 1 percent of the times it is needed.
- The shared-bus N+1 uses modules four times as reliable as a block path, in series with one bus and one utility and generator path.
- Equipment unit costs per kW of rated capacity, mock 2026 dollars: UPS 450, generator 800, low-voltage distribution 250, MV transformer 120, controls 40, transfer switches 60 where used. Each block that has its own utility and generator adds 350,000 dollars of fixed cost for MV switchgear, paralleling and pad. Installation, testing and commissioning add 45 percent on top of equipment.
Anchor for the cost numbers. JLL and CBRE report all-in data center construction at roughly 10 to 11 million dollars per MW in 2025 (see the summary of their figures), and estimates of the electrical share run from about 40 to 50 percent, so 4 to 5 million dollars per MW of IT. The mock totals below land at 3.2 to 5.2 million per MW, which is consistent for electrical-only scope. They exclude the utility service and substation (a mock substation cost of about 444 dollars per kW of IT is worked out in a later post), batteries beyond the UPS, mechanical plant and the building, which is why they sit below that range.
python3 bmc/sld_cost.py
python3 bmc/sld_cost.py sens
Mock cost breakdown, 2,400 kW of IT load, millions of dollars.
| Design | Installed kW | UPS | Generators | LV dist | MV xfmr | Controls | STS | Block fixed | Total with install | $/kW of IT |
|---|---|---|---|---|---|---|---|---|---|---|
| 2N | 4,800 | 2.16 | 3.84 | 1.20 | 0.58 | 0.19 | 0 | 0.70 | 12.57 | 5,237 |
| Distributed, 3 make 2 | 3,600 | 1.62 | 2.88 | 0.90 | 0.43 | 0.14 | 0 | 1.05 | 10.19 | 4,245 |
| Catcher, 3 plus 1 | 3,200 | 1.44 | 2.56 | 0.80 | 0.38 | 0.13 | 0.14 | 1.40 | 9.94 | 4,142 |
| N+1 shared bus | 3,000 | 1.35 | 2.40 | 0.75 | 0.36 | 0.12 | 0 | 0.35 | 7.73 | 3,220 |
Three things stand out. Generators are the largest line in every design, about 44 percent of the equipment cost, so the design that installs the fewest generator kW is cheapest. The fixed cost per block makes the distributed design and the catcher cost about the same even though the catcher installs less capacity: four blocks pay four sets of fixed costs, three blocks pay three. 2N is 63 percent more than the shared-bus N+1 for the same load.
Mock reliability result.
| Design | Availability | Downtime, minutes a year | Maintainable without a risk window |
|---|---|---|---|
| 2N | 99.9991% | 4.9 | yes |
| Distributed, 3 make 2 | 99.9990% | 5.1 | yes |
| Catcher, 3 plus 1 | 99.9976% | 12.6 | yes |
| N+1 shared bus | 99.9494% | 265.8 | no |
The shared bus is worse by a factor of 50 because it is one series path for every rack: its modules can be redundant, but the utility feed, the generator path and the bus are not. 2N and the distributed design are within 0.2 minutes of each other. That is a modeling result and not a coincidence: once two or more independent paths exist, the common-mode term, not the count of blocks, sets the floor.
Sensitivity to common-mode failure. Downtime in minutes a year as the common-mode share of outages is varied:
| Common-mode share | 2N | Distributed | Catcher | N+1 shared bus |
|---|---|---|---|---|
| 0% | 0.1 | 0.3 | 7.8 | 261.0 |
| 2% | 4.9 | 5.1 | 12.6 | 265.8 |
| 5% | 12.1 | 12.3 | 19.8 | 273.0 |
| 10% | 24.1 | 24.3 | 31.8 | 284.9 |
At 10 percent common mode the 2N design needs 24 minutes a year, which is already close to a 99.995 percent target. Extra blocks buy almost nothing against a shared cause. What does is diversity: different firmware versions per side, separate commissioning teams and staged energization, and physical separation of the two sides.
What an extra minute costs. If extra capital is financed at 10 percent a year and compared to the shared-bus N+1, each design pays back at an outage cost of:
| Design | Extra cost a year | Break-even outage cost |
|---|---|---|
| 2N | 484,000 dollars | 1,855 dollars per minute |
| Distributed | 246,000 dollars | 944 dollars per minute |
| Catcher | 221,000 dollars | 874 dollars per minute |
A hall whose outage costs more than about 1,900 dollars a minute, or about 111,000 dollars an hour, justifies 2N over the shared bus on these numbers. A hall below about 900 dollars a minute justifies none of the block-level designs on cost alone. The numbers are only as good as the outage cost, which for a training cluster that checkpoints every 30 minutes is much lower than for a payment system, and that difference is the actual trade-off to defend.
Choosing against a target.
| If the target is | Choose | Because |
|---|---|---|
| Lowest capital, outage tolerated, one UPS room | N+1 shared bus | 3,220 dollars per kW, no second path, and maintenance on the bus needs a shutdown |
| Concurrent maintenance and about 12 minutes a year at the lowest cost | Catcher | 4,142 dollars per kW, easy to operate, spare block can carry one failed primary |
| 5 minutes a year with the lowest cost of the multi-path designs | Distributed redundant | 4,245 dollars per kW, 19 percent below 2N, needs load pairs kept balanced |
| Simplest to explain, audit and operate, fault tolerance | 2N | 5,237 dollars per kW, each rack cord traces end to end on one path |
Explaining it to a non-specialist. The one-sentence version for a finance or product reviewer is: “2N costs about 2.4 million more than distributed redundant and buys almost no measurable availability, but distributed redundant requires us to keep three load groups balanced for the life of the hall; if the operations team cannot commit to that, pay for 2N.” The version for a peer engineer adds the common-mode sensitivity and the per-failure-case loading check, which are the two things a reviewer will try to break.
Defending the choice under review
A design review attacks the assumptions, not the arithmetic. The questions below are the ones this post’s numbers have to survive, with the answer the post supports.
- “Why not the shared-bus N+1, it is 38 percent cheaper than 2N?” It is 4.8 million dollars cheaper and has about 266 minutes of modeled downtime a year, because every rack depends on one bus and one feed. It is right only if the outage cost is below about 900 to 1,900 dollars a minute and the room can tolerate a shutdown for bus maintenance.
- “Is 2N worth 2.4 million more than distributed?” The model says they differ by 0.2 minutes of downtime a year, so on availability alone, no. 2N is the choice when the operations team cannot keep three load groups balanced, or when each rack cord must trace end to end on one path for audit.
- “What if your failure data is wrong?” The model is built to show sensitivity. At 10 percent common-mode, 2N and distributed are within 0.2 minutes of each other at about 24 minutes a year, and the ranking of the four designs does not change, so the decision survives a large error in the inputs. An absolute availability figure does not.
- “What happens in the second failure?” All four designs are at 100 percent after one loss and the two-blocks-out table shows what remains. The answer is the repair time and the maintenance policy, not the architecture.
- “Does the utility give you two independent sources?” The model treats the blocks as independent. If the two feeds share a substation or a right of way, the common-mode share is higher than assumed. The interconnection post covers the utility side.
For a non-specialist the same points reduce to three numbers: the extra capital, the minutes of outage it buys back, and the outage cost at which the two are equal.
Challenges
- Normal loading hides the real limit. The unbalanced distributed hall showed a highest block of 75 percent, and each failure case still overloaded a survivor. The check has to run per failure case and not on the normal load. In a real hall the pairs drift as racks are added, so the check has to be repeated.
- Spare capacity is used up by the first failure. All four designs end at 100 percent on the busiest block after one loss. Until the failed block is repaired, the hall is running with no spare, and a maintenance outage in that window is a second event.
- Maintenance counts as a failure. Taking a block out for work puts the hall in the same state as a fault. Planned work therefore needs the same capacity check as a fault.
- A shared path is a single point. The shared-bus N+1 has the lowest installed capacity and a single output bus. The catcher’s reserve path passes through transfer switches that can fail. Counting blocks does not show these, which is why the diagram has to be read for shared parts.
- A whole block of load can move at once. In the catcher, a failed primary hands 800 kW to a block that was at zero. In the distributed design the survivors take on a third more load. How the UPS and generators handle that step is not in this exercise.
Differences with a production setup
- Block sizes. UPS modules and transformers come in discrete sizes and not in the exact 600, 800 or 1,200 kW I used. Rounding up changes the installed capacity and the loading.
- Everything behind the UPS. Generators, fuel, transformers and the mechanical plant need redundancy too, and the cooling load is not in my 2,400 kW. A real design carries all of them through the same architecture.
- Load types. Real halls have single-corded equipment, which needs a transfer switch or a different arrangement to get a second path. I assumed everything is dual-corded.
- Reliability numbers. The model above uses assumed failure and repair times, one block path with one forced outage a year. Real comparisons use component failure rates and repair times, for example the data and methods of IEEE Std 493, the Gold Book (now inactive and carried on in IEEE 3006.8), and run each component and each switching state, not one number per block. The US Army’s TM 5-698-1 runs the Gold Book’s standard network through such a calculation and reports for each load point the interruptions per year, the hours of interruption per year, the average duration and the availability. The failure and repair times in this post are assumed and are not taken from that standard. The availability arithmetic in the Part 6 power plan assumed independent failures, which this post does not repeat.
- Classification. The Uptime Institute tiers rate whole sites. Their Tier III is concurrently maintainable with redundant distribution paths, and Tier IV adds fault tolerance. A design diagram alone does not earn a tier.
- Electrical rules. The NFPA 70 National Electrical Code and local rules govern the equipment and wiring. For a diagram like this one the main split is how each backup supply is classified. EC&M’s comparison gives Article 700 emergency systems 10 seconds to restore power, Article 701 legally required standby systems 60 seconds, and Article 702 optional standby a time that is typically set by a business risk assessment, and selective coordination is required for the first two, as the short-circuit post covers.
- Studies. A real design runs load-flow, short-circuit and coordination studies in software such as ETAP, SKM or EasyPower, with a model of the real equipment. The two scripts here are arithmetic on assumed numbers, so they stand in for the study’s logic and not for its accuracy: the breaker-level studies are in the short-circuit post.
FAQ
Why does 2N install so much more than the others?
Each side must carry the whole hall on its own, so the installed capacity is twice the load. The other designs share the spare across blocks, so they install 1.25 to 1.5 times.
Why does distributed redundancy run at 67 percent with three blocks?
When one block fails, its load splits over the two that remain. For the survivors to end at 100 percent, they have to start at two thirds. With n blocks and equal pairing the figure is (n-1)/n.
What goes wrong when the load pairs are not equal?
A failed block hands its load to its partners in proportion to how much it shared with each. If one partner already carries more, it ends above its rating even though every block was under its rating before the failure.
What is the weak point of a catcher?
Its spare covers one failure at a time, and each primary’s path to the spare goes through a transfer switch. After a primary fails, the catcher is full and the hall has no spare.
Why can a shared bus defeat a redundant UPS?
Five modules give module redundancy but all of them feed one bus. A fault on that bus or its breaker is a full outage with nothing failed in the UPS.
Is a design with lower installed capacity less reliable?
Not by that fact alone. Reliability depends on shared parts, repair times, maintenance practice and operations. The capacity numbers here show the cost side only.
What will change the most between this example hall and a real one?
The equipment inside each block. Real UPS units, transfer switches and breakers have their own failure rates and behavior, which change how the redundancy options compare.
Repeating with real hardware
Coming soon. There is no hardware version of a data center power architecture at home scale. The repeat is a model in study software with real equipment data, or a review of a real single-line diagram.
Next
Take the quiz to test your understanding: Electrical series quiz
The next post in this series covers a short-circuit and selective coordination exercise from the transformer to a rack breaker.
Comments