Goal
This series follows electricity along one chain, from the generator to the chip. The chain has five stretches: generation and siting, the utility connection, the medium-voltage substation, the hall (transformer, switchgear, UPS, busway and rack), and the load itself. Most of the posts that follow are in the hall. This one stays at the far end of the chain and asks what a data center is plugged into.
We use one example site throughout: twenty halls of 2.4 MW of IT at a PUE of 1.3, which is 62.4 MW at the utility meter, flat all year. We ask four questions of it. What is the grid made of, and where are the sources? Why do data centers cluster where they do? How much generating nameplate does a flat load need from each kind of source? And what changes when a site builds its own generation because the grid cannot deliver on time?
Terms used in this post
- Nameplate capacity: the maximum output a generator is rated for, in MW.
- Capacity factor: energy actually produced in a period divided by what the nameplate would produce running flat out for that period.
- Dispatchable: a source whose output an operator can raise or lower on request, such as a gas turbine, as opposed to wind and solar, which follow the weather.
- Baseload: load that is there around the clock. A data center is close to flat, so it is baseload by shape.
- Behind-the-meter (BTM) generation: a generator on the customer’s side of the utility meter, serving the site directly.
- Interconnection queue: the list of generation and load requests a grid operator studies in order before allowing a connection.
- RTO and ISO: a regional transmission organization or independent system operator, such as PJM or ERCOT, that runs the grid and its markets for a region.
- Aeroderivative turbine: a gas turbine adapted from an aircraft engine, delivered as a compact package in the tens of MW.
What I built
bmc/sources.py, a script with four calculations for the example site: nameplate by source from published capacity factors, the storage a solar-only supply would need to hold a flat load overnight, the gas and the turbine count of an on-site plant, and the site’s share of national generation. A chart of the nameplate result. Every input that is not a published figure is marked as an assumption in the script.
How it works
What the grid is made of
EIA’s 2024 figures put US utility-scale generation at 4,155 billion kWh, with natural gas at 1,767 billion kWh, about 42 percent, nuclear at 781 billion, coal at 647 billion and renewables at 945 billion. EIA’s 2025 summary of 4.43 trillion kWh gives gas about 41 percent, renewables about 24, nuclear about 18 and coal about 17. Inside renewables, wind is about 11 percent, solar about 7 and hydropower about 6.
The three sources that can be told to run, gas, coal and nuclear, make up most of the supply. Wind and solar make up a quarter and follow the weather. A data center asks for the same power at 3 a.m. as at noon, so the question for a site is not the average mix. It is which sources are there when the load is.
Where the sources are
Generation is concentrated by geography, and the pattern shapes where load can connect.
- Wind: most capacity is in the middle of the country. Texas, Iowa, Oklahoma, Kansas and Illinois produced about 52 percent of 2025 wind generation.
- Solar: Texas had 20 percent of 2025 utility-scale solar generation and California 18.
- Hydropower: about half of conventional hydro capacity is in Washington, California and Oregon. Washington alone made 26 percent of 2025 hydro generation, then Oregon 12 and California 11.
- Nuclear: 94 reactors at 54 plants in 28 states as of March 2026, most of them east of the Mississippi. Illinois has 11 reactors.
- Natural gas: five states made 70.4 percent of 2022 dry gas production: Texas, Pennsylvania, Louisiana, West Virginia and Oklahoma. The Marcellus shale in Ohio, Pennsylvania and West Virginia is the largest shale gas source.
Fuel and wind are located where the resource is. Load is located where people, fiber and land are. The transmission grid is the part that has to connect them, and it is the constrained part.
Where data centers are
The load is concentrated too. Northern Virginia is the largest data center market: a 2026 market summary puts Northern Virginia colocation inventory at 4,496.5 MW in the first half of 2026 and says Virginia has 8 GW of data centers operating and 4 GW under construction, against about 4 GW operating and 6.5 GW under construction in Texas. The two measures in that article are colocation inventory and state totals, so they do not add up against each other.
Nationally, Lawrence Berkeley National Laboratory’s report for DOE finds that data centers used about 4.4 percent of US electricity in 2023, 176 TWh, up from 58 TWh in 2014, and projects 6.7 to 12 percent by 2028. The IEA’s Energy and AI report puts global data centre use at about 415 TWh in 2024, with the United States at 45 percent, China 25 and Europe 15, and projects more than double to around 945 TWh by 2030. In the IEA’s supply mix, renewables and natural gas lead, nuclear adds about the same energy as gas, and half of the growth is met by renewables.
What a flat load needs from each source
The script divides the site’s 62.4 MW by each source’s capacity factor. EIA’s 2025 fleet-average factors are 91.1 percent for nuclear, 33.8 for wind, 34.4 for hydro and 24.0 for solar PV, and 58.7 percent for gas combined cycle and 48.8 for coal.
Solar plus storage, simulated by the hour
The one-day arithmetic hides what a year does. A clear day and a three-day overcast stretch need different amounts of storage, and a bigger solar field spills energy on sunny days that the battery cannot absorb. The script’s hybrid mode runs a synthetic year hour by hour: a half-sine of sunlight between 6 and 18 hours, a seasonal amplitude, a cloud factor for each day, scaled so the annual capacity factor is the EIA fleet value of 24.0 percent. A battery with a power rating equal to its energy per hour and an 85 percent round trip serves the flat 62.4 MW load. The profile is synthetic and a real study uses measured irradiance for the site. Wind with storage follows the same method with a wind profile, and a hybrid plant at one point of interconnection shares one inverter and one connection, which is what interconnection rules for hybrids address.
Commands and results
python3 bmc/sources.py nameplate storage fuel share hybrid
python3 bmc/sources.py plot sources-nameplate.png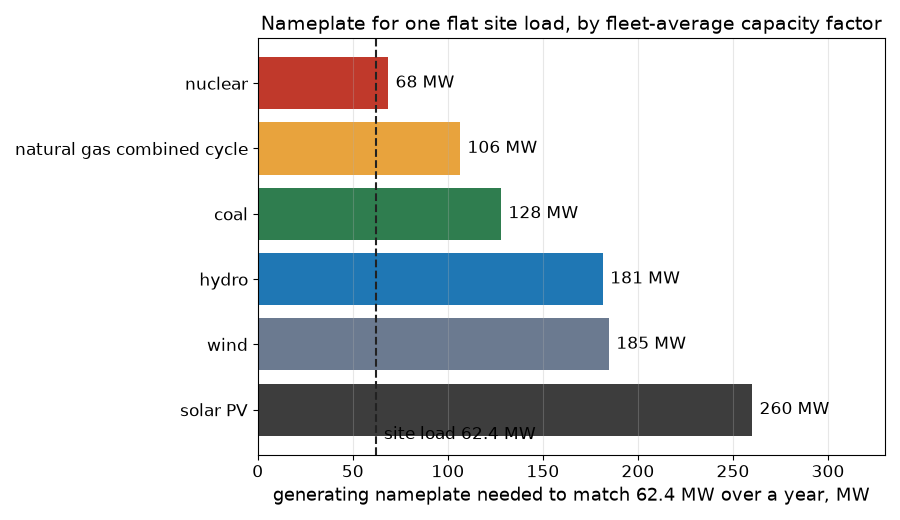
The site is 547 GWh a year. Matching that energy takes 68 MW of nuclear, 106 MW of gas combined cycle, 128 MW of coal, 181 MW of hydro, 185 MW of wind or 260 MW of solar PV. These are ratios of energy, so they are exact only for a fleet-average plant. A real wind farm in Iowa and one in Ohio have different factors.
Solar plus storage over a year. The share of the load served by solar and battery, with the rest left to the grid or on-site generation:
| Solar | no battery | 500 MWh | 1,000 MWh | 2,000 MWh | 4,000 MWh |
|---|---|---|---|---|---|
| 260 MW | 41% | 65% | 80% | 86% | 88% |
| 400 MW | 44% | 70% | 90% | 97% | 99% |
| 600 MW | 45% | 73% | 94% | 99% | 99.9% |
| 900 MW | 45% | 75% | 97% | 99.6% | 100% |
A 260 MW field, the nameplate that matches the annual energy, serves only 41 percent without storage and 86 percent with 2,000 MWh, because cloudy days and short winter days leave more shortfall than one average day suggests. Getting from 90 to 99 percent takes roughly four times the storage, and the extra solar spills most of what it makes. That is why a firm supply for a flat load combines a hybrid plant with on-site or grid generation and treats the last few percent as a different problem.
Solar alone cannot hold a flat load. If the sun is up ten hours, 14 hours of the day have to come from storage: 874 MWh at 62.4 MW. At an assumed 85 percent round trip the battery must take in 1,028 MWh, the day needs 1,652 MWh of generation, and the solar nameplate rises from 260 MW to 287 MW. Those are the figures for one average day. They ignore weather, winter, degradation and a battery that is never idle. A multi-day cloudy stretch makes the battery the smaller part of the problem.
An on-site gas plant. At an assumed 9,500 Btu/kWh, 62.4 MW burns about 593 MMBtu an hour, 14,227 MMBtu a day and 5.19 million MMBtu a year, which is about 13.7 million cubic feet a day at an assumed 1,037 Btu per cubic foot. In 35 MW units the load needs two, N+1 needs three (105 MW installed) and N+2 four (140 MW). The 35 MW figure is the size of one commercial aeroderivative package reported in Power Engineering’s survey of on-site power.
Scale. 547 GWh is 0.013 percent of 2024 US generation. The 176 TWh that data centers used in 2023 is 322 sites of this size.
Challenges
- Capacity factor is not capacity credit. A 260 MW solar farm and a 68 MW reactor deliver the same annual energy to this site, but only the reactor delivers it on a still winter night. A supply plan needs hourly or at least seasonal profiles and not annual factors, which is why studies of a firm supply add storage or dispatchable generation.
- Time to power decides the architecture. The Power Engineering survey describes developers turning to on-site generation because of the shortage of available grid power in many areas and lengthening interconnection queues, and notes large-frame turbine delivery slots increasingly booked years in advance. A site that cannot wait builds a bridge, which the generation posts later in this series work through.
- A pipeline is a single feed too. An on-site gas plant moves the single point of failure from the transmission line to the gas supply. The fuel contract, the lateral pipeline and the pressure at the plant need the same redundancy thinking as the electrical feeds, and on-site storage of a second fuel is a common answer.
- Where is the load relative to the source. A site in a region with surplus hydro or wind but weak transmission can wait years for a connection, while a site in a congested region with plenty of nearby generation can wait just as long. The constraint is the wires and the studies, not only the megawatts.
- Concentration is a risk for the grid and the fleet. A large share of the load in one region means a regional event, a heat wave or a transmission fault, hits many halls at once. Later posts cover the 2024 load-loss event that made this concrete.
Production setup example
Real siting is a study and a negotiation, not a division. A developer asks a utility or a grid operator for service of a stated size and date, and the answer depends on the queue position, the transmission nearby and the generation behind it. Virginia and Texas show two arrangements: a dense market with a mature grid and long waits, and a market growing fast with its own interconnection pressures. On-site generation is already common enough to have its own names in the market: a Power Engineering survey describes the Abilene, Texas campus for Oracle and OpenAI running on GE Vernova LM2500XPRESS, Solar Turbines Titan 350 and Dynamis DT35 packages, on a site that could consume as much as 1.2 GW.
The teaching numbers here are fleet averages and assumed heat rates. A real procurement uses the capacity factor of the specific resource, an hourly model of the load and the supply, and the vendor’s guaranteed heat rate at site conditions.
FAQ
Why divide the load by the capacity factor?
A capacity factor is the fraction of the nameplate a plant delivers over a year. To deliver a given annual energy the nameplate has to be the energy divided by that fraction and by the hours.
Why does nuclear need so little nameplate?
It runs almost flat out all year. EIA’s 2025 fleet average was 91.1 percent.
Why is solar alone not enough for a data center?
The load is flat and the sun is not. Overnight energy has to come from storage or another source, and storage adds losses and a larger solar field to fill it.
Why do operators build their own generation?
Grid connection can take years and equipment lead times are long. A turbine package can be delivered and energized on a site while the utility finishes its upgrades, and later it becomes backup or is retired.
Where should a data center go?
Where power, fiber, land and permits line up. In practice that means near strong transmission and generation, which is why a few regions hold much of the load.
What does this post not show?
A siting study, an hourly supply model or a cost. It shows the scale of each source for one flat load and why the next posts spend their time on the connection and the equipment.
Repeating with real hardware
Coming soon. The closest repeat is to download one year of hourly generation and load data for a real region from its operator and rerun the nameplate and storage arithmetic against the actual hours.
Next
Take the quiz to test your understanding: Electrical series quiz
The next post in this series covers utility interconnection and the medium-voltage substation.
Comments