Goal
A power design says what the hall could carry. Metering says what it does carry, rack by rack and minute by minute, and the gap between the two is where money and risk sit. Capacity that is reserved and never used is stranded. A rack that draws more than one feed can carry loses its redundancy without anyone noticing. A cooling plant that works harder than it should raises the PUE long before anything fails.
This post builds the monitoring for one hall of 12 racks. There are no real meters, so I wrote an exporter that emulates them from a small model, pointed a local Prometheus at it, and wrote the rules that turn the readings into stranded power, PUE and alerts. Then I broke three things and timed the alerts.
Terms used in this post
- Branch-circuit meter: a meter on one circuit that feeds a rack, usually in the rack PDU or at the busway tap-off.
- IT power: the power drawn by servers, storage and network equipment.
- Facility power: the power the whole site draws from the utility, including cooling, UPS losses and lighting.
- PUE: power usage effectiveness, facility power divided by IT power. A PUE of 1.3 means 0.3 W of overhead for every watt of IT load.
- Stranded power: capacity that has been provisioned for a rack and is not used by it.
- Exporter: a small service that exposes readings in the format Prometheus scrapes.
- Recording rule: a Prometheus rule that computes a new series from existing ones on a schedule.
- Alerting rule: a Prometheus rule that fires when an expression stays true for a set time.
- Partial PUE: the same ratio for one part of a site, such as a single hall.
What I built
bmc/meter_exporter.py, an exporter for 12 racks on a 2N design: four GPU racks, four compute racks and four storage racks, each with an A and a B feed. Each feed is a 415 V three-phase circuit with a 100 A breaker, which is 54.6 kW at 80 percent continuous and power factor 0.95. Readings come from a model with a little noise, and a control file switches faults on.- Facility readings from the same model: cooling is 22 percent of the IT power plus 12 kW fixed, UPS loss is 3.5 percent of the IT power, and other loads are 3 kW. These are my assumptions.
- A local Prometheus with a 2 s scrape and a rules file (
bmc/meter-rules.yml) that records per-rack power, hall IT power, PUE and stranded power, and four alerts: a rack that draws more than one feed can carry, a feed that reads zero, a meter that stopped reporting, and a PUE above 1.45. - A drill (
bmc/meter_drill.py) that switches on a lost feed, a missing meter and degraded cooling in turn and records when each alert fires.
How it works
Capacity and stranded power. In a 2N design a rack must be able to run from either feed alone, so the capacity that counts for a rack is that of one feed. Stranded power for a rack is that capacity minus what the rack draws. A negative value means the rack cannot ride through the loss of a feed.
PUE. The rule divides the facility meter by the sum of the rack meters. It is an instantaneous value here. A real PUE is reported over time. The Green Grid’s white paper 49 says to report the average PUE measured over one year, and if that is not possible, a period of at least one month with typical load.
Alerts. An alert fires when its expression is true for 6 s. With a 2 s scrape, a 2 s rule evaluation and the 6 s wait, I expect an alert to take between 7 and 10 s to fire after a fault starts.
The three faults. A lost feed makes rack r05’s A meter read zero and its B meter carry the whole rack. A missing meter makes rack r07’s B reading disappear while its capacity series stays. Degraded cooling raises the cooling power to half of the IT power.
Commands and results
python3 bmc/meter_exporter.py
prometheus --config.file=bmc/prometheus-meter.yml --web.listen-address=127.0.0.1:9096
python3 bmc/meter_drill.py
python3 bmc/meter_report.py rack
python3 bmc/meter_report.py pue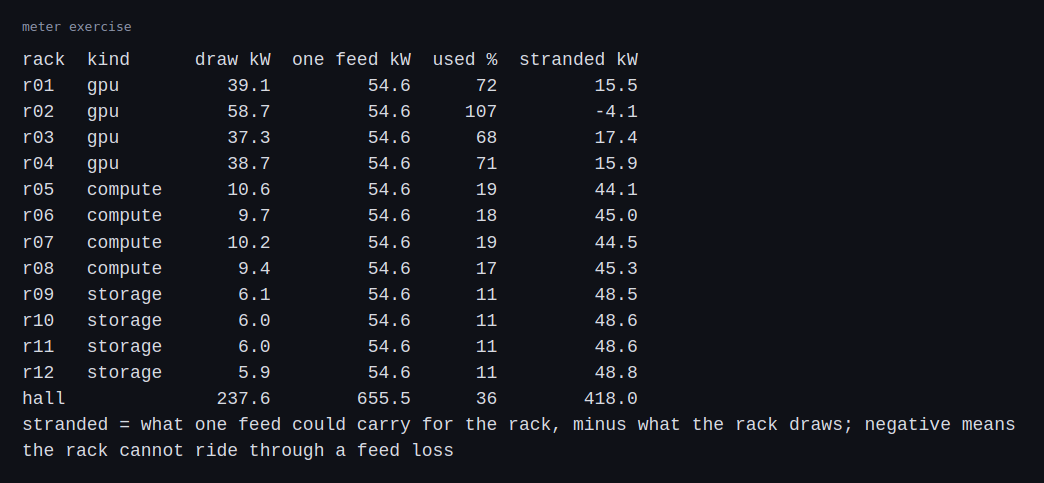
The hall draws 237.8 kW of IT power against 655.5 kW of capacity counted on one feed per rack. That is 36 percent used, and 417.8 kW is stranded. The GPU racks use 70 to 72 percent of their feed. The compute racks use 17 to 19 percent and the storage racks 11 percent, so most of the stranded power is in racks that were provisioned like GPU racks and are not used like them.
Rack r02 draws 57.6 kW against 54.6 kW for one feed. Its stranded power is negative, 3.0 kW. If either feed were lost, the other would have to carry more than its continuous rating. The alert for this fired at the start of the run and stayed on.
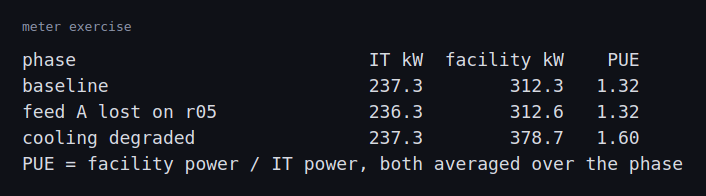
At baseline the IT power is 237.3 kW, the facility draws 312.3 kW and the PUE is 1.32. With a feed lost on r05 nothing changes at the hall level, 1.32 again, because the rack moves its load to the other feed and the total is the same. With the cooling degraded the facility draws 378.7 kW and the PUE is 1.60.
The fixed parts of the overhead matter at lower load. With the same model and an IT power of 100 kW, the facility would draw 140.5 kW and the PUE would be 1.41.
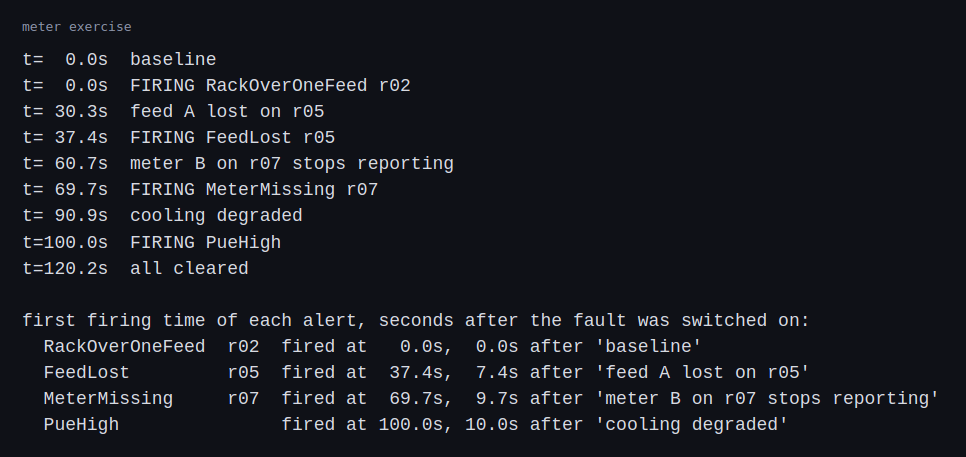
The lost feed fired its alert 7.4 s after it was switched on. The missing meter took 9.7 s and the PUE alert 10.0 s. That is the scrape and evaluation intervals plus the 6 s wait, as expected.
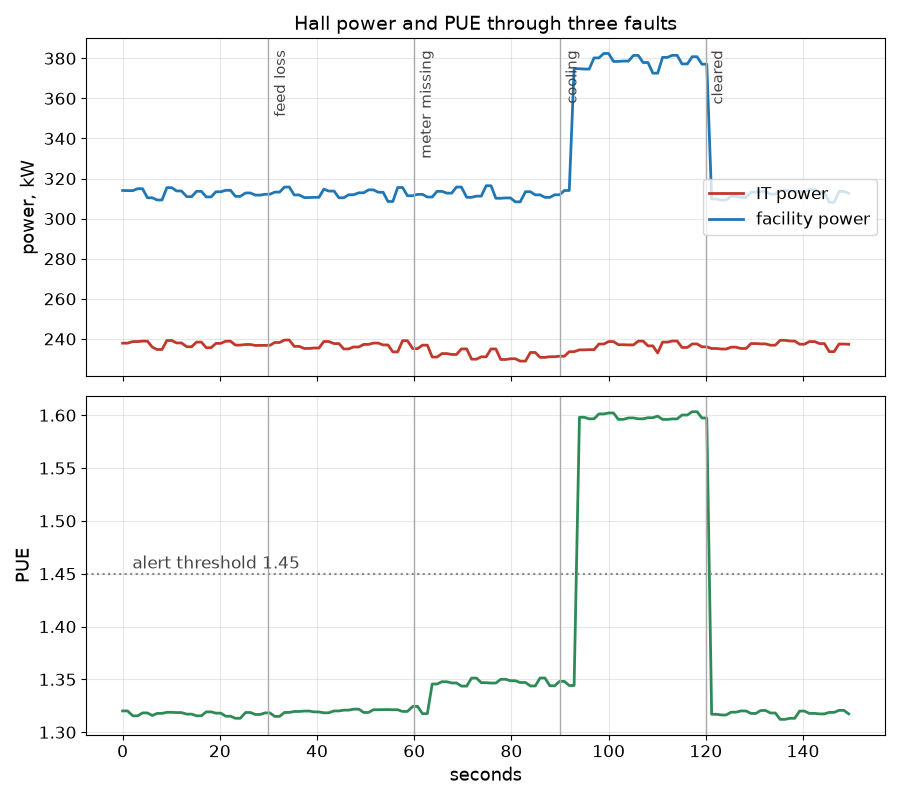
The top plot shows the IT power dip by about 5 kW at 60 s, when the B meter of r07 goes silent, and the facility power step up when the cooling degrades at 90 s. The lower plot shows the PUE reading 1.35 instead of 1.32 after the meter goes missing, because the IT power is understated. It then jumps to 1.60 and above the 1.45 line when the cooling degrades, and returns to 1.32 when the fault is cleared at 120 s. The feed loss at 30 s moves neither line, and only its alert shows it.
Challenges
- A meter that stops reporting makes every total wrong. With the B meter of r07 gone, the hall IT total drops by about 5 kW and the PUE reads 1.35 instead of 1.32. Neither value looks bad, and the PUE stays under its alert threshold. The alert for a missing meter exists to catch it, and without it the stranded power and the PUE would both be quietly off.
- A redundancy loss does not show in the totals. The feed loss on r05 changed neither the IT power nor the PUE. It took a per-feed rule to see it.
- A standing alert gets ignored. The alert for r02 fired at the start and never cleared. Alerts like that need an owner and a decision, either to move load off the rack or to accept the risk in writing.
- PUE depends on where the meters are. Metering the IT load at the UPS output, at the PDU or at the server gives different numbers, because losses between the meter and the server count as IT or as overhead depending on where it sits. Comparing two sites needs the same boundary.
- PUE moves with load. A hall that fills slowly runs at a higher PUE because the fixed overhead is spread over less IT power. A single reading says little without the load next to it.
- Reclaiming stranded power is a project. The capacity sits in racks that are already built and fed. Using it means moving equipment or changing the provisioning, which has a cost and a schedule.
Differences with a production setup
Where a measurement, a standard, a datasheet or a vendor rating disagrees with a number in this post, the number in this post is the one that is wrong. The values most likely to differ are the PUE of about 1.32 from an assumed overhead model, the 54.6 kW feed capacity from an assumed 100 A at 415 V, PF 0.95 and 80 percent continuous, and the scrape and for-duration settings that set the alert delay.
- Real meters. Branch-circuit readings come from metered PDUs or tap-off meters over SNMP, Modbus or Redfish, with accuracy classes and calibration. Mine come from a model.
- Metering design. A real hall decides the metering points and the boundary for IT power before building. I chose one and used it.
- PUE practice. The Green Grid developed PUE, and ISO/IEC 30134-2 standardizes it. The Green Grid’s white paper 49 defines three levels by where IT energy is metered. Level 1 meters at the UPS outputs, Level 2 at the PDU outputs and Level 3 at the IT equipment inputs, with total facility energy taken at the utility inputs, and the measurement interval gets finer at each level, from monthly or weekly down to 15 minutes or less. The second edition of ISO/IEC 30134-2, from 2026, keeps that idea as PUE measurement categories 1 to 3 (basic, intermediate and advanced resolution) and has a clause on partial PUE; its free preview shows the table of contents. Partial PUE covers all the energy-using components inside a boundary such as a container, room or pod. The Green Grid says that, like PUE, it is best used as a management tool and not for comparison with other facilities.
- Other metrics. Water use and carbon intensity have their own metrics that are separate measurements from the power-side PUE here.
- Prometheus practice. The recording rules and alerting rules here are small. Production setups add routing and silencing through Alertmanager, long-term storage and dashboards, which this exercise leaves out.
- Capacity management. Data center infrastructure management tools track capacity, circuits and reservations across a site. This exercise has one rule.
- Scale. A real site has thousands of circuits, and the cost and cardinality of the series matter. Mine has 24 branch circuits.
FAQ
What is stranded power?
Capacity that has been provisioned and fed to a rack but is not used by it. In the example it is 417.8 kW out of 655.5 kW.
Why does a 2N rack count one feed as its capacity?
Either feed has to carry the rack alone after a failure. The usable capacity is therefore that of one feed, and a rack above it loses its redundancy.
Why did the feed loss not change the PUE?
The rack’s total draw did not change. Its load moved from one feed to the other. Only the per-feed meters see it.
Why does PUE rise at low load?
Cooling and other overhead have fixed parts. At 237 kW of IT load the model gives 1.32, and at 100 kW it gives 1.41.
Why does an alert take seven to ten seconds?
The scrape interval, the rule evaluation interval and the 6 s wait for the condition all add up. A shorter wait is faster and gives more false alerts.
What will change the most between the emulated meters and real ones?
The readings and their noise. Real meters report with their own accuracy and sample intervals, so the alert thresholds and timing will need to be set again on real readings.
Repeating with real hardware
Coming soon. A metered PDU on a real rack would give real branch-circuit readings to feed through the same rules.
Next
Take the quiz to test your understanding: Electrical series quiz
The next post in this series covers commissioning documents: a basis of design, a sequence of operations and an integrated systems test script for the example hall.
Comments