Goal
A UPS sits between the switchgear and the load, and it does two jobs. It holds the load through a power disturbance, and it keeps carrying the load on batteries until a generator takes over. Each topology does that job in a different way, and the way decides how much power the UPS wastes when nothing is wrong, which is almost all of the time.
This post compares three topologies on an assumed efficiency model, applies it to the four redundancy designs from the redundancy post, and does the battery arithmetic for one block: how much energy to install for five minutes, and how long that lasts at lighter loads.

Terms used in this post
- Double conversion: a UPS that always rectifies the incoming AC to DC and inverts it back to AC, so the load never sees the utility directly. IEC 62040-3 calls the class VFI, output independent of input voltage and frequency.
- Line-interactive: a UPS that passes the utility through and corrects the voltage, switching to its inverter and battery when the utility fails. IEC 62040-3 calls the class VI.
- Standby (offline): a UPS that feeds the load from the utility and switches to the inverter when the utility fails, without regulating in between. IEC 62040-3 calls the class VFD.
- Eco mode: a mode of a double-conversion UPS where the load runs on the static bypass in normal operation and moves to the inverter when the utility goes out of tolerance. Also called high-efficiency mode.
- Static bypass: a path around the UPS that connects the load to the input through power electronics, used when the inverter fails or for eco mode.
- Fixed loss: the power a UPS consumes at zero load to run its electronics, fans and magnetics.
- Ride-through: how long the batteries carry the load before the generators or the utility take over.
- End of life: the point at which a battery is replaced, commonly when it holds 80 percent of its rated capacity.
- VRLA: a valve-regulated lead-acid battery, the sealed type common in UPS rooms.
- Li-ion: a lithium-ion battery.
What I built
bmc/ups.py, a script with three parts: an efficiency model for three topologies, a loss total for each redundancy design from the redundancy post, and the battery arithmetic for one block.- The efficiency model is a loss curve: loss as a fraction of the UPS rating is a fixed part, plus a part that grows with load, plus a part that grows with the square of the load. I assumed the coefficients. They give plausible shapes and are not a vendor’s data.
- The same hall as before: 2,400 kW of critical load with the loading of each block from the redundancy post.
- A battery sizing for one 1,200 kW block: five minutes of runtime, an inverter at 96 percent and an end-of-life capacity of 80 percent.
How it works
Topologies. A double-conversion UPS processes all the power twice, so it has the best protection and the most loss. A line-interactive UPS passes the power through and processes only the correction, so it loses less but leaves the load exposed to frequency variation. A standby UPS passes the utility straight through and gives the least protection. Eco mode makes a double-conversion UPS behave like a standby one in normal operation, and returns to double conversion when the input is out of tolerance.

Efficiency. Loss = rating × (f + l·x + q·x²) with x the load as a fraction of the rating. Efficiency is the load divided by the load plus the loss. For double conversion I assumed f = 1.0 percent, l = 1.0 percent and q = 1.2 percent. For line-interactive I assumed 0.5, 1.0 and 0.5 percent, and for eco mode 0.3, 0.3 and 0 percent. The fixed part is what makes efficiency fall at light load.
Battery. The energy out of the battery is the load divided by the inverter efficiency, times the runtime. A new battery has to hold more than that, because the design has to be met at end of life, when it holds 80 percent of its rated capacity. So the nameplate energy is the required energy divided by 0.8. Runtime at lighter loads is the usable energy times the inverter efficiency, divided by the load. This is constant-power arithmetic.
Commands and results
python3 bmc/ups.py eff arch
python3 bmc/ups.py runtime
python3 bmc/ups.py plot ups-efficiency.png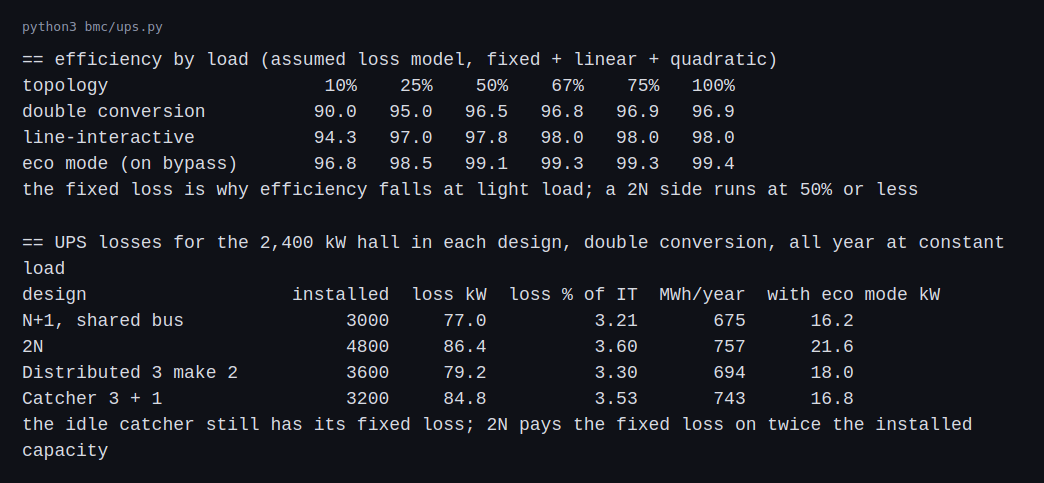
Double conversion runs at 96.9 percent at full load and 96.5 percent at half load, and falls to 95.0 percent at a quarter and 90.0 percent at a tenth. Line-interactive is at 98.0 to 97.8 percent over the upper range. Eco mode is at 99.1 percent at half load.
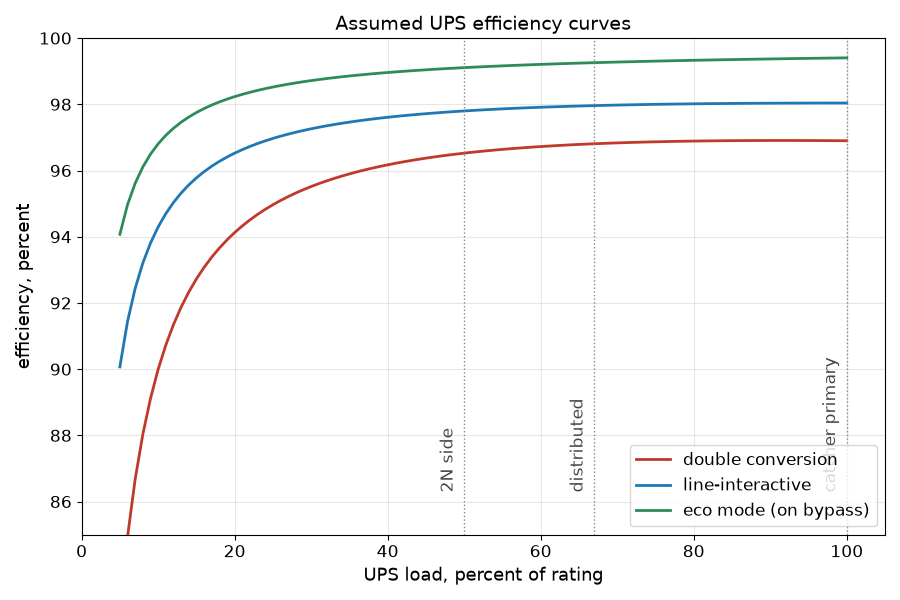
The dotted lines mark where each design from the redundancy post runs its blocks: a 2N side at 50 percent, a distributed block at 67 percent and a catcher primary at 100 percent. The curves separate by topology more than they change along each design’s operating point.
For the 2,400 kW hall on double conversion, the shared-bus N+1 loses 77.0 kW, which is 3.21 percent of the IT load and 675 MWh a year. The distributed design loses 79.2 kW. The catcher loses 84.8 kW, because the idle catcher still costs its fixed loss. The 2N loses 86.4 kW, 3.60 percent and 757 MWh a year, because it pays the fixed loss on 4,800 kW of installed capacity. With eco mode the totals fall to between 16.2 and 21.6 kW.
On my assumptions the difference between designs is about 9 kW. The difference between double conversion and eco mode is 60 kW or more. How a UPS is run matters more than which of these four designs it sits in. Eco mode gives up the double-conversion protection in normal operation, so that saving is not free.
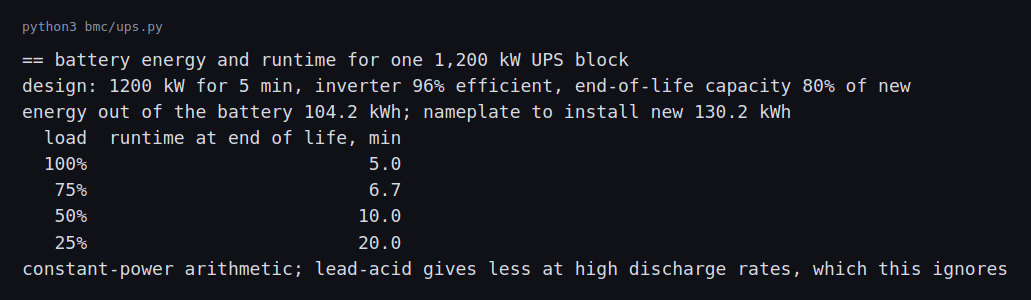
Five minutes at 1,200 kW takes 104.2 kWh out of the battery at the 96 percent inverter efficiency. To have that at end of life the new battery needs a nameplate of 130.2 kWh. At 75, 50 and 25 percent of the load the same battery lasts 6.7, 10.0 and 20.0 minutes.
Generators and storage behind the UPS
The UPS only bridges. The energy for a long outage comes from on-site generation, and large sites add grid-scale storage on the utility side. This section sizes both for one block of the redundancy post and says where my numbers are likely to be wrong. As in the rest of the series, where a vendor curve, a site standard or the code says something different, the case study is the one that is wrong.
Generator sizing for the example block. A 1,200 kW IT block at a PUE of 1.3 (assumed) is 1,560 kW of facility load. The generators carry the UPS input, the cooling plant and the building loads, not just the IT number. Two assumptions change the count most:
- Rating class. Generator sets are sold with standby, prime and continuous ratings under ISO 8528-1, and data center sets are often bought on a standby or a data-center-continuous rating. The class sets how many kW the same engine can carry and for how long, so the count in a design depends on which one the vendor certifies.
- Redundancy. The block’s generators are themselves N+1: if the facility needs 1,560 kW and a set is rated 2,000 kW, one set carries it and a second is the spare. Two sets per block, four for a 2N hall, is a different capital number than the one set the load alone suggests, and it is a large part of why generators are the biggest equipment line in the cost model in the redundancy post.
Step-load acceptance. When the transfer happens, the generator takes the load in one or a few steps, and its voltage and frequency dip. The prime mover’s allowed step, in percent of rating, comes from the engine maker’s data and the performance class in ISO 8528-5 (G1 to G4). A UPS rectifier with a soft-start ramp, set to bring load on over several seconds, is the usual way to keep the first step within it. A 1,560 kW step on a 2,000 kW set is 78 percent, which most engines cannot take in one step, so the ramp or a staged transfer is part of the design and not an option.
Fuel. At an assumed 0.27 L per kWh at full load, 1,560 kW burns about 421 L an hour. That is about 20,200 L for 48 hours and about 40,400 L for 96. The NFPA 110 class (the hours of fuel on site) and the local permit set the actual number, and the fuel consumption curve is read from the specific engine, which is partial-load dependent.
Ride-through time. The five minutes in my battery sizing is an assumed figure. Real sites set it from the generator start and transfer time, the number of start attempts the owner wants to cover and the operations policy, and some designs size the battery for much less when the generator start is quick and monitored. If a site standard or a vendor’s recommendation differs from five minutes, my figure is wrong and not the standard.
Storage on the utility side. A battery energy storage system at the site is a different job from the UPS battery. A UPS battery carries the critical load for minutes. A site BESS is connected at medium voltage and is sized in megawatts and megawatt-hours to do things like shave peaks, soften load swings seen by the utility (the next post covers that for GPU loads), and in some designs ride through an outage. It brings its own design inputs:
- Standards. NFPA 855 covers installation of stationary energy storage, and UL 9540 is the system listing, with UL 9540A as the fire test method for thermal runaway propagation. The authority having jurisdiction reads the large-scale fire test result when it approves spacing and suppression.
- Interconnection. A BESS that can export has its own utility interconnection study, which is separate from the load interconnection.
- Where it fits in the architecture. On the single-line diagram it sits on the medium-voltage bus behind the utility service, so it can be shared by blocks, or inside a block behind a transformer. It is a source in the short-circuit study with its own contribution, and it has to be coordinated like a generator.
Evaluating a UPS on technical merit
A datasheet is a sales document, and a design review asks what each number was measured under. A short checklist for comparing two vendors’ UPS offers, with the reason for each line:
- Efficiency at which load and mode. Compare the curve at the loads the design will run, 25 to 50 percent in a 2N hall, and not the peak figure at full load. The loss model in this post shows why: the fixed loss makes light-load efficiency the number that matters.
- Efficiency mode behind the figure. A headline figure may be for eco mode, which gives up some protection. The IEC 62040-3 class (VFI, VI or VFD) says what the output is protected against.
- Rated power and power factor. A UPS rated in kVA at 0.9 and one rated in kW at unity carry different loads from the same frame, and modern server loads are close to unity.
- Overload and short-circuit behavior. The overload capability and time, and the fault current the inverter will supply and for how long, are inputs to the load transfer and the coordination study.
- Battery runtime at end of life and temperature. Ask for runtime at the end-of-life capacity, the temperature, the end voltage and the discharge rate, not new at 25 degrees. The battery maker’s discharge tables decide this.
- Reliability claims. An MTBF is a population figure and depends on what counts as a failure. Schneider Electric argues that UPS reliability depends on system design and not on MTBF, and that a battery failure may not count as a UPS failure. Ask what is counted, and look at the redundancy post for why the architecture usually matters more.
- Witnessed test. A factory witness test of efficiency and transfer at stated loads is worth more than a brochure, and the commissioning post shows where it sits in the sequence.
- Serviceability. Module replacement time sets the repair time in the reliability model, so a 4 hour repair and a 24 hour repair give different availability.
Challenges
- Batteries age without warning. A battery that tests fine at commissioning can fall under 80 percent of its capacity years later. Runtime tests and periodic capacity tests are how an operator finds out, and a failed string means the runtime on the label is no longer true.
- A UPS is least efficient when it is lightly loaded. A hall that fills slowly runs its blocks at 10 to 25 percent for a long time, and the fixed loss is a large share of what it draws. Staging the build, or switching blocks off until they are needed, changes the bill.
- Eco mode trades protection for efficiency. The load sits on the utility until the UPS sees a disturbance, and the transfer to the inverter has to be fast enough for the load. Operators have to decide which halls accept that.
- The runtime number depends on the load. A battery sized for five minutes at full load runs longer when the block is lightly loaded and shorter when it is overloaded after a failure. In the 2N design a block that picks up its partner’s load goes from 50 to 100 percent and its runtime halves.
- Batteries need space, cooling and fire protection. Lead-acid and lithium-ion rooms have different requirements for ventilation, spacing and fire protection. They are a design input and not a purchase detail.
Differences with a production setup
Where a measurement, a standard, a datasheet or a vendor rating disagrees with a number in this post, the number in this post is the one that is wrong. The values most likely to differ are the efficiency coefficients, the 96 percent inverter, the five-minute ride-through and the 80 percent end-of-life factor.
- Vendor data. Real UPS efficiency comes from tested curves for a named model. My coefficients only give plausible shapes.
- Classification. IEC 62040-3 defines the VFI, VI and VFD classes and how to test them. The three classes are voltage and frequency dependent (VFD, the offline or standby type), voltage independent (VI, line-interactive) and voltage and frequency independent (VFI, double conversion), which one UPS maker’s guide lays out with their transfer times and uses. The full code also gives an output waveform class and a dynamic performance class under transient loads, which Fuji Electric’s guide describes as the conditions IEC 62040-3 defines for testing.
- Battery sizing. Real sizing follows the discharge tables of the battery maker for a rate in watts per cell, with a design margin, temperature correction and an end voltage. I used energy and a constant-power assumption. Lead-acid gives less capacity at a high discharge rate, which my numbers ignore. IEEE Std 450 is the recommended practice for maintaining and testing vented lead-acid batteries, and it recommends replacing a battery whose measured capacity falls below 80 percent of the manufacturer’s rating (DOE handbook). Results are trended, and a drop of more than 10 percent from the last test, or a battery at 85 percent of its expected life, moves capacity tests to yearly (Vertiv paper).
- Chemistry. Vendors present lithium-ion as lasting longer and taking less space than VRLA, at a higher price and with different fire-protection requirements. The sizing applies one 80 percent end-of-life factor to either; real aging curves differ by chemistry and temperature. NFPA 855 covers the installation of stationary energy storage systems.
- Generators and transfer. Ride-through only has to cover the start of the generators, and I used five minutes as an assumed design figure. Real sites set it from the start time, the number of start attempts and the operations policy.
- Paralleling and bypass. Real blocks have several modules in parallel with bypass cabinets, and the loss model is per block.
FAQ
Why does a UPS lose power when nothing is wrong?
A double-conversion UPS runs all the power through a rectifier and an inverter all the time, and its electronics, fans and magnetics use power even at zero load. That is the fixed loss.
Why is efficiency lower at light load?
The fixed loss is the same at any load, so it is a larger share of a small load. In the model it is 1.0 percent of the rating, which is 10 percent of the output at a tenth of the load.
Why does 2N lose the most here?
It installs the most capacity, and each side runs at 50 percent or less where the fixed loss is a bigger share. The loss is only a few kilowatts more than the others on my assumptions.
Is eco mode safe?
It depends on the load. The load runs on the utility in normal operation, so it sees the utility’s disturbances until the UPS reacts. Whether that is acceptable is a decision for each hall.
Why size the battery for end of life?
A battery loses capacity as it ages. Sized new for the design runtime, it would fall short before it is replaced.
What will change the most between this example and a real UPS?
The battery and the vendor curves. A real discharge curve and aging change the runtime figures, and the vendor’s efficiency curves change the loss figures.
Repeating with real hardware
Coming soon. A small UPS and a battery meter would let me measure the efficiency curve and the runtime of a real unit at several loads, though a small line-interactive unit is a different machine from a data center block.
Next
Take the quiz to test your understanding: Electrical series quiz
The next post in this series covers grounding, harmonics and power quality.
Comments