Goal
An arc fault releases energy as heat, light and pressure, and a person standing at the equipment takes some of it. How much depends on the current in the arc, how long it lasts and how far away the person is. The number that results is the incident energy, and it decides what a worker must wear, how far back others must stand and whether the work can be done with the equipment live at all.
The coordination post ended on a trade-off: delay the upstream breakers so the rack breaker acts first, and an arc at the switchboard burns longer. This post puts numbers on that trade-off with equations I could check against a published example, and says plainly what those equations do not cover.

Terms used in this post
- Arc flash: the release of energy from an electric arc between conductors or from a conductor to ground.
- Incident energy: the thermal energy that reaches a surface at a given distance from the arc, in calories per square centimetre (cal/cm²) or joules per square centimetre.
- Working distance: the distance from the arc to the worker’s face and chest, taken as 18 in for a panelboard and 24 in for switchgear in this post.
- Bolted fault current: the current of a short circuit with no arc impedance, the value from the short-circuit calculation.
- Arcing current: the current that flows through the arc itself, which is lower than the bolted fault current.
- Arc flash boundary: the distance from the arc at which the incident energy falls to 1.2 cal/cm², the level that can cause the onset of a second-degree burn.
- Arc rating: the incident energy a piece of clothing or equipment is tested to withstand, in cal/cm².
- PPE category: a grouping in NFPA 70E for arc-rated clothing, with minimum ratings of 4, 8, 25 and 40 cal/cm² for categories 1 to 4.
- Clearing time: how long the protective device takes to open and extinguish the arc.
- Maintenance mode: a setting on some trip units that removes the delay, so the breaker trips instantly while someone works near the equipment.
What I built
bmc/arcflash.py, a script with two equations from the open-air methods in NFPA 70E’s older annexes: the Lee equation, E = 793 × F × V × t / D², and the Doughty equation for 600 V and below. F is the bolted fault current in kA, V the voltage in kV, t the clearing time in seconds and D the distance in inches.- A check of the script against a published worked example before any other result.
- Incident energy at the two points from the coordination post: the switchboard bus at 52.3 kA with a 24 in working distance, and the panel bus at 17.0 kA with 18 in. For each I used the clearing times from the post’s case A, all instantaneous, and case B, with short-time delays on the feeder and main.
- A table of how the energy changes with clearing time, and a label for the switchboard assembled from the numbers.
How it works
The equations. Lee’s equation comes from the maximum power an arc in open air can transfer, spread over a sphere. It needs only the voltage, the bolted current, the time and the distance, and it is a simple model. The Doughty equation is an empirical fit for open arcs at 600 V or below, valid from 16 to 50 kA and at 18 in or more, so it does not apply at 52.3 kA. Both assume an arc in open air and not one inside a box, and I come back to what that means below.

The check. A vendor spreadsheet that cites these equations gives a worked example: 0.48 kV, 22.6 kA, 0.1 s, 18 in. Its results are 2.66 cal/cm² from Lee and 2.82 cal/cm² from Doughty, with a boundary of 26.77 in. My script gives 2.66, 2.82 and 26.8. The constant in the Lee equation also has a form for distances in millimetres, 5.12 × 10⁵, and it gives the same 2.66 for 457.2 mm.
Categories. I compared each result with the minimum arc ratings of the four PPE categories, 4, 8, 25 and 40 cal/cm². Below 1.2 cal/cm², the incident energy at which bare skin starts to get a second-degree burn and the value at which WC Safety’s guide to NFPA 70E places the arc flash boundary, the model puts no clothing requirement. Above 40 cal/cm², the top category, the Electricity Forum’s summary of NFPA 70E says a 40 cal suit often signals that the energized work itself should be questioned.
Commands and results
python3 bmc/arcflash.py check energy
python3 bmc/arcflash.py delay label
python3 bmc/arcflash.py plot arc-time.png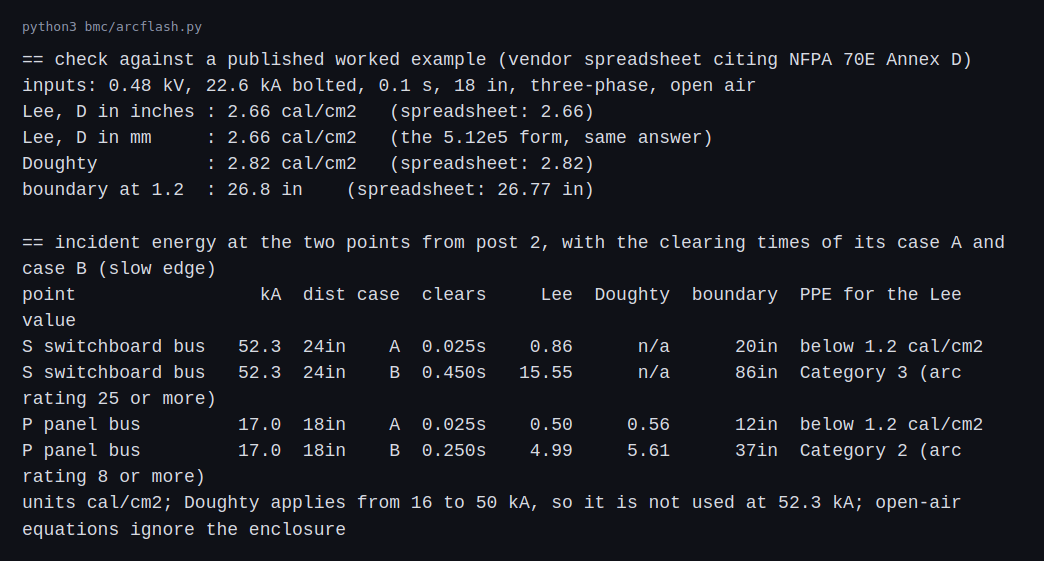
The check matches the published example to the digit. At the switchboard bus with the case A settings, an instantaneous trip that clears in 0.025 s, the Lee energy is 0.86 cal/cm² and the boundary is 20 in, which is below the 1.2 cal/cm² line. With case B, where the main waits 0.45 s at its slow edge, the energy is 15.55 cal/cm², the boundary is 86 in and the result lands in category 3. At the panel bus, case A gives 0.50 cal/cm² by Lee and 0.56 by Doughty. With case B, where the feeder waits 0.25 s, Lee gives 4.99 and Doughty 5.61, both in category 2.
The delay that makes the rack breaker selective with the main raises the energy at the switchboard by a factor of 18, which is the ratio of 0.45 s to 0.025 s.
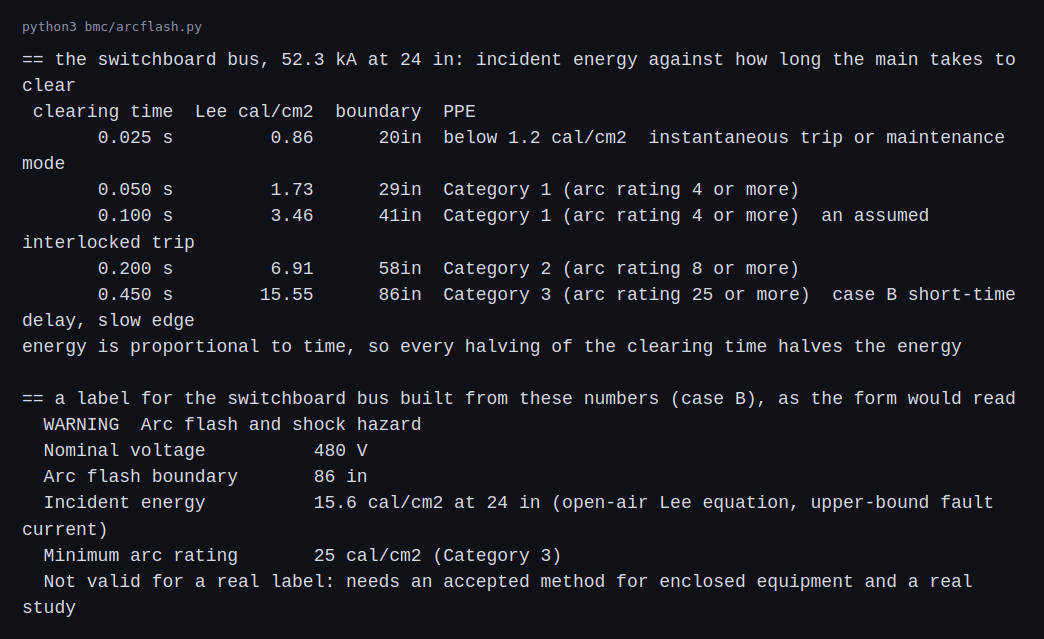
For a 52.3 kA fault at 24 in the energy is proportional to the clearing time. A 0.05 s trip gives 1.73 cal/cm², 0.1 s gives 3.46, 0.2 s gives 6.91 and 0.45 s gives 15.55. The boundary grows with the square root of time, from 20 in at 0.025 s to 86 in at 0.45 s. The label at the bottom shows what the form carries: the voltage, the boundary, the incident energy with the distance, and the minimum arc rating. It carries a warning that it is not valid for a real label.
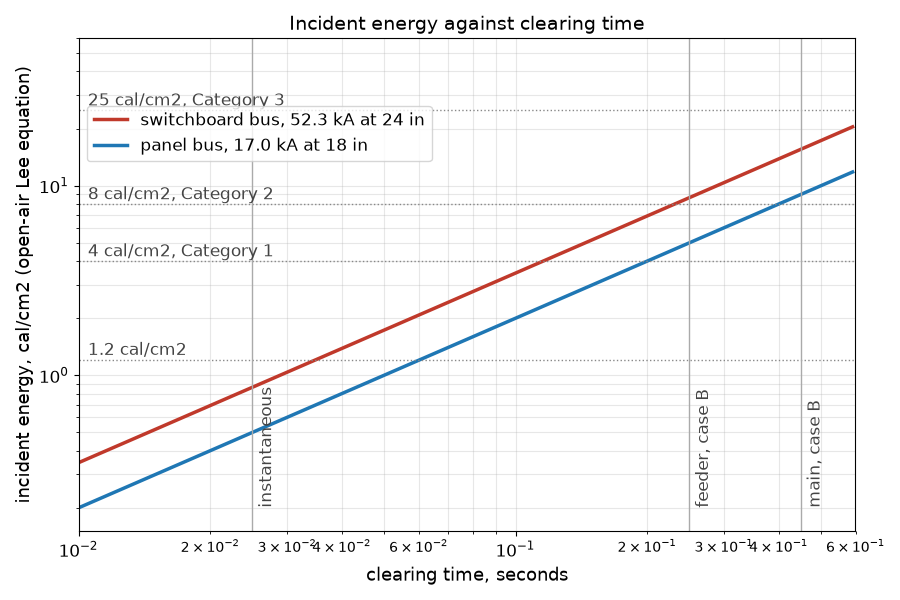
The two lines run parallel on the log plot because energy is proportional to time. The vertical lines mark the clearing times of the cases. The same fault current at a lower clearing time sits in a lower category, and several of the ways to get there are mitigations described below and not modeled in the script: a maintenance mode that removes the delay, an interlock that lets the upstream breaker trip fast when the downstream one is not restraining it, and optical arc detection that trips on the light.
From the case study to a labeled panel
The script above gives the shape of the problem. A real arc flash study replaces every number in it. This section describes what the replacement looks like, and the rule for reading it against this post is that the study wins: if an IEEE 1584-2018 calculation for the same switchboard disagrees with my 0.86 or 15.55 cal/cm², the study is correct and the case numbers are wrong.
Inputs per equipment, as the study software asks for them. For each bus or panel, IEEE 1584-2018 needs the nominal voltage, the bolted fault current, the electrode configuration (the five are vertical conductors in a box, vertical with an insulating barrier, horizontal in a box, and vertical or horizontal in open air), the conductor gap, the enclosure width, height and depth, the working distance and the clearing time of the protective device. The standard tabulates typical gaps and working distances by equipment class. Secondary summaries put the gap at about 25 mm for low-voltage panelboards and MCCs and 32 mm for low-voltage switchgear, and the working distance at 18 in for panelboards and MCCs. Verify these against the standard itself before using them, because they are secondhand here. My examples used 24 in at the switchboard and 18 in at the panel, which are reasonable choices and not values taken from the table.
Two arcing currents, not one. IEEE 1584-2018 calculates an arcing current from the bolted current, then a second, lower one that reflects variation in the arc. The study runs both. The reason is the clearing time. A lower arcing current can sit on a different part of the breaker curve, in the short-time or long-time region and not the instantaneous one, and the longer clearing time can give a higher incident energy than the full-current case. My script used the bolted current and one clearing time, and that is the biggest difference from a real study.
Minimum and maximum source cases. The study is run for the utility’s minimum and maximum available fault current and for each operating mode, as in the short-circuit post. A bus can have its worst arc flash with the lowest fault current, because the protective device takes longer to clear it. A hall with a generator source, a tie breaker closed or one block out has several worst cases, not one.
What goes on the label. NFPA 70E’s equipment labeling rule asks for the nominal system voltage, the arc flash boundary and at least one of the following: the available incident energy with its working distance, the minimum arc rating of clothing, or the site-specific level of PPE. Trade sources such as Schneider Electric’s guide summarize this, and the standard has the exact text and exceptions. The study is reviewed at least every five years and after changes to the system, and the method used is documented.
Reducing the energy by design. Beyond the settings trade-off in case A and case B, the NEC requires arc energy reduction for circuit breakers rated 1,200 A or more under 240.87, with several accepted methods: zone-selective interlocking, differential protection, an energy-reducing maintenance switch, an active arc-flash mitigation system or an instantaneous trip setting. In my path the main (a 2,500 kVA transformer at 480 V carries about 3,000 A) is above that threshold and the 400 A feeder and 30 A rack breaker are not, so the 0.4 s delay in case B on the main would need one of these methods in a real design. Zone-selective interlocking is the one that keeps the coordination intent: the downstream breaker signals the upstream one to hold when the fault is below it, and the upstream trips instantly when it is not.
The review checklist for a study report. Equipment list matches the single-line diagram and field survey; each device’s settings match the coordination study; fault currents trace to a utility letter and the transformer test data; both arcing currents and both source cases were run; the working distance and enclosure size are stated for each bus; clearing times above two seconds are flagged and justified (IEEE 1584 notes a worker may move away from a long arc, but that is a judgment to document); and each label can be traced to a line in the report.
Challenges
- Coordination and arc flash pull in opposite directions. The delay that keeps a rack fault from taking out the feeder is the delay that makes a switchboard arc last longer. A design has to choose where the delay goes, and an energy-reducing setting for when people work nearby.
- An arc draws less current than a bolted fault. Arcing current can be well below the bolted value, so a breaker’s instantaneous pickup may not be reached and the arc can burn on the long-time or short-time curve. My equations use the bolted current. The IEEE 1584 method calculates the arcing current.
- Labels go out of date. A change in the source, the settings or the equipment changes the number on the label. NFPA 70E asks for the arc flash assessment to be reviewed at intervals of at most five years, a limit the 2021 edition added and the 2024 edition keeps, and after changes to the system. One equipment distributor’s summary adds that the review does not call for a recalculation unless it finds changes, and that the decision has to be documented.
- Settings drift matters here too. A raised pickup or a lengthened delay that is harmless for coordination raises the energy at the bus behind it.
- Energized work is a decision and not a default. At the higher categories the practical answer is to de-energize. In a hall with dual-corded racks this depends on the redundancy being intact, which links back to the redundancy post.
Differences with a production setup
- Method. The accepted method for an arc inside equipment is IEEE Std 1584-2018, which uses electrode configuration, enclosure dimensions, voltage, gap and the arcing current, and gives different results for enclosed equipment. It has five electrode configurations, vertical or horizontal conductors in a box or in open air, plus vertical conductors ending at an insulating barrier. It also takes the working distance, the clearing time from the breaker or fuse curve, and an enclosure size correction that includes a shallow-enclosure case, and it covers about 208 V to 15 kV (NSA’s summary, ETAP’s summary). It no longer depends on whether the system is grounded, according to Power Control Engineers. The calculation in this post does not use it. The Lee and Doughty equations are open-air methods, and the spreadsheet I checked against says they are not recommended for arcs in a box.
- Source of the example. The worked example is from a vendor spreadsheet hosted by an IBEW local that cites NFPA 70E Annex D. It is a secondary source, so the match checks my arithmetic against a published calculation and does not establish what the standard says.
- Standards. NFPA 70E covers electrical safety in the workplace, including labels, PPE categories and the boundary. The category ratings of 4, 8, 25 and 40 cal/cm² and the 1.2 cal/cm² boundary value match the table and definitions in WC Safety’s guide.
- Inputs. A real study uses the actual fault current, device curves, settings and clearing times, and the minimum and maximum arcing current. I used the upper-bound fault current and the assumed breaker model from the coordination post.
- Mitigation. Real designs use maintenance modes, zone-selective interlocking, arc-flash relays, current-limiting devices and remote operation. I named them and did not model them.
- Study software. ETAP, SKM and EasyPower do this work, and the results go into labels and a safety program. The script here is a calculator; in a project its output feeds labels and a safety program.
FAQ
What is incident energy?
The thermal energy per unit area that reaches a surface at a given distance from the arc. In this post it is in calories per square centimetre.
Why is the arc flash boundary set at 1.2 cal/cm²?
That is the level that can cause the onset of a second-degree burn on bare skin. Beyond that distance a person without arc-rated clothing is expected to be below it.
Why does a longer clearing time raise the energy?
The arc releases energy at a roughly steady rate, so the total is proportional to how long it lasts. Doubling the time doubles the energy.
Why does the energy depend on the distance squared?
The energy spreads over a sphere around the arc. At twice the distance the area is four times larger, so the energy per unit area is a quarter.
Are the Lee numbers safe to use for a label?
No. Lee’s method takes the maximum power an arc can transfer and spreads it in open air. It does not model the arc voltage, the electrode configuration or the enclosure, so for 480 V equipment in a box its result can differ from an IEEE 1584-2018 result in either direction, and I do not claim it errs on the safe side. The case numbers (0.86 and 15.55 cal/cm²) show how clearing time moves the energy. They are not values to put on equipment, and where a 1584-2018 study disagrees with them, the study is right.
Does the box around the arc make it better or worse?
It can make it worse. Equipment enclosures can direct and concentrate the energy, which is why IEEE 1584 has models for enclosed arcs. My open-air numbers are not a substitute.
What will change the most between this and a real arc-flash study?
The method and the data. An accepted calculation for enclosed equipment, real arcing current and the device curves of the actual equipment produce the numbers that go on a label.
Repeating with real hardware
Coming soon. There is no safe home-scale test of an arc fault. The repeat is the same calculation in study software on real equipment data, checked against a published example for that software.
Next
Take the quiz to test your understanding: Electrical series quiz
The next post in this series covers a reading post on 400 V and 800 V DC distribution for GPU racks.
Comments