Goal
In Part 4 the model server scaled on CPU use. CPU is a lagging and indirect signal: the pods have to get busy before it moves, and it says nothing about how much work is waiting. KEDA lets a Kubernetes workload scale on other signals, including a query against Prometheus, which the cluster already has.
I wanted to scale the model server on its request rate, compare that with the CPU autoscaler under the same load, and try scale to zero. This is the second post in Part 5, the platform layer. The lab has three small nodes, so the numbers describe that.
Terms used in this post
These build on the earlier glossaries.
- HorizontalPodAutoscaler (HPA): the Kubernetes controller that changes a workload’s replica count to hold a metric at a target.
- External metric: a metric that does not come from the pods or nodes themselves, such as a Prometheus query or a queue length.
- KEDA: an add-on that turns such a signal into an external metric and manages an HPA for it.
- ScaledObject: the KEDA object that names the workload, the replica limits and the triggers.
- Trigger: one signal KEDA watches, with a threshold.
- Scale to zero: running no pods when there is no work.
- Cold start: the time from the first request to a pod that can answer it.
What I built
KEDA 2.21.0, installed from its release manifest. It runs three small deployments: an operator, a metrics server and an admission webhook.
One ScaledObject points at the model server:
- The signal is the Prometheus query
sum(rate(inference_requests_total[30s])), the requests per second across all pods. - The target is 40 requests per second per replica, with 2 to 6 replicas.
KEDA creates a normal HPA from that object, named keda-hpa-model-server, so the scaling itself is still done by the Kubernetes controller. The CPU autoscaler from Part 4 targeted 60% of the pods’ CPU request, with the same limits of 2 to 6 replicas.
 Diagram: the pods, Prometheus, KEDA and the HPA that KEDA manages.
How it works
KEDA runs the query and publishes the result as an external metric. The HPA divides the value by the target per replica and rounds up, so 190 requests per second asks for 5 replicas. Prometheus gets the numbers by scraping the pods every 15 seconds, so the signal is as fresh as the scrape and the 30 second window of the rate.
KEDA’s own validation printed two warnings when I applied the object. Its polling interval and cooldown period only matter when scale to zero is allowed. With a minimum of 2 replicas, the HPA’s own loop decides when to scale.
Commands and results
Same load, two autoscalers. I started each run with 2 replicas and an idle minute. Then I applied the autoscaler and a load job at concurrency 16 for 150 seconds. Each run was done once, and times are seconds after I applied the load.
| Run | 4 replicas ready | 6 replicas ready | Requests per second | p95 (ms) | p99 (ms) | Errors |
|---|---|---|---|---|---|---|
| CPU autoscaler | 48 s | 65 s | 285.5 | 107 | 189 | 0 |
| KEDA, request rate | 34 s | 51 s | 299.3 | 106 | 176 | 0 |
KEDA reached four and six replicas about 14 seconds before the CPU autoscaler, and the whole-run figures were close. I would not read that as a win. The CPU autoscaler took 32 seconds and 44 seconds to reach the same counts in Part 4, so the same autoscaler varied by about 16 to 21 seconds between runs, which is more than the gap between the two.
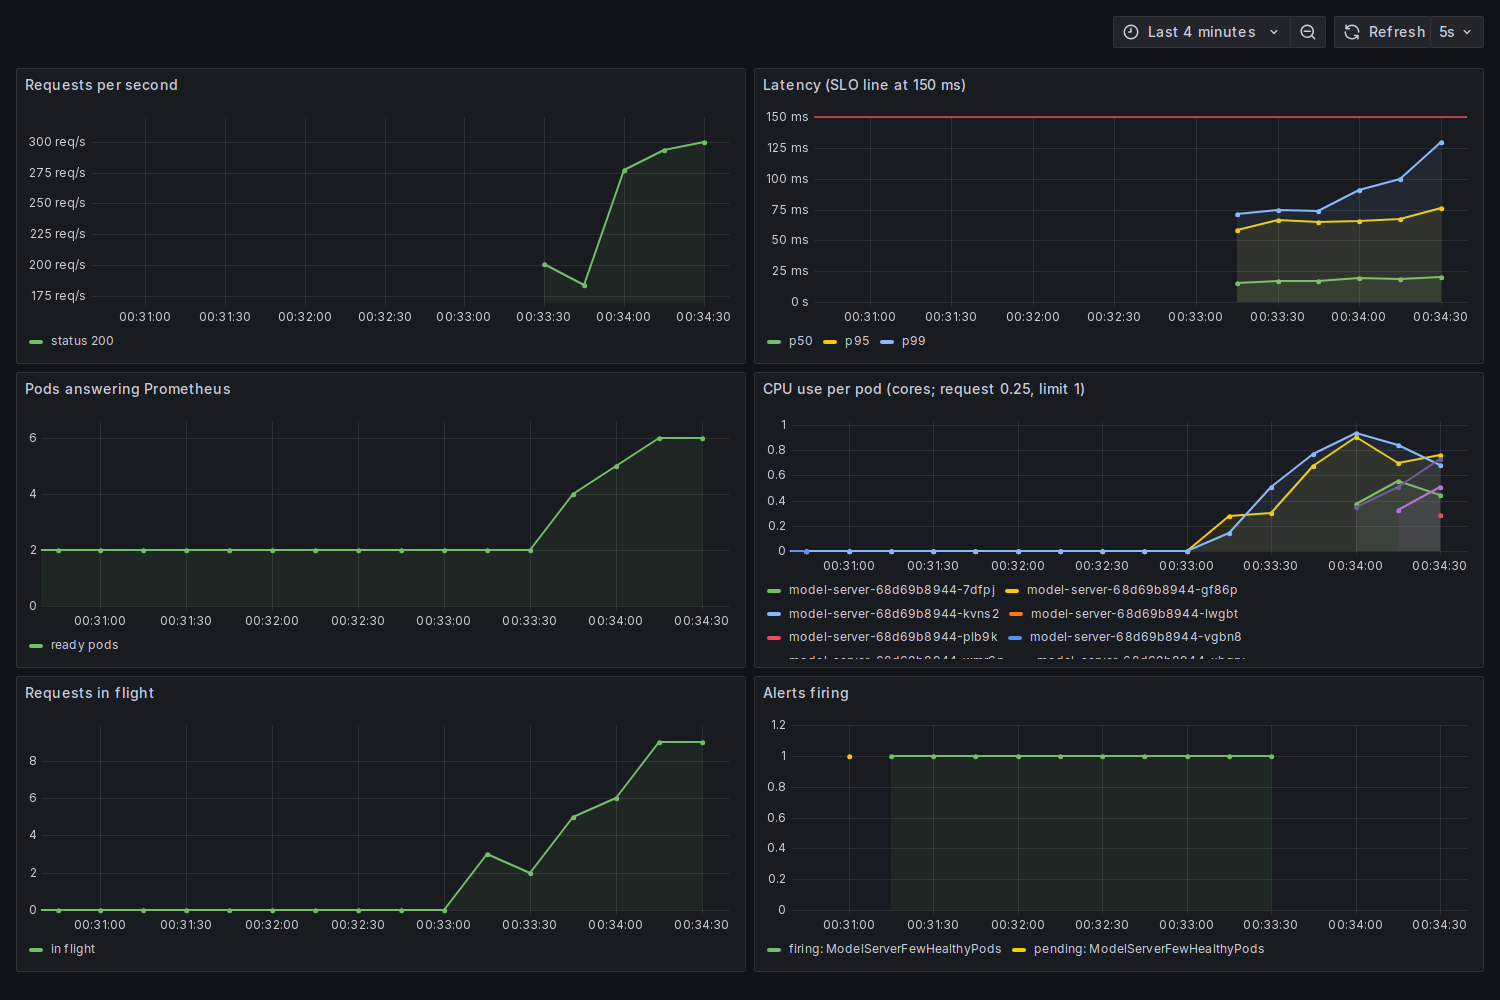 Screenshot: a second run of the request-rate test with the model server dashboard open. The pod count steps from 2 to 6 as the request rate climbs past 275 requests per second, and the p99 latency stays under the 150 ms line. The alert panel shows the pod-count alert from Part 4 firing while fewer than three pods were running.
Scale to zero. I allowed a minimum of zero replicas. With no traffic, the model server went from 2 replicas to 0 within seconds. Then I started a load of 8 concurrent requests for 40 seconds. All 70 requests failed, none succeeded, and the replicas stayed at zero for the 90 seconds I watched. The autoscaler’s target showed <unknown>.
Challenges
- Scale to zero with a metric that comes from the pods does not work. The request rate is measured by the model server pods. With none running, Prometheus has nothing to scrape, the query returns no data, and nothing ever asks for the first replica. A service scaled to zero needs a signal from in front of it, such as a queue length or a proxy that counts and holds requests, and the HTTP traffic here had neither.
- Two autoscalers on the same workload are a hazard. KEDA manages an HPA, and the Part 4 HPA targeted the same deployment. I deleted one before applying the other. Two controllers would fight over the replica count, and in a fleet, ownership of that setting needs to be unambiguous.
- A comparison from one run each says little. The runs differed from earlier ones by more than the effect I was measuring. A real comparison needs repeated runs and a spread for each, which I did not do.
- The autoscaler now depends on the monitoring stack. If Prometheus is down or its data is gone, the signal is missing. My Prometheus keeps its data in memory and loses its history when restarted, and I did not test what KEDA does then.
What this lab cannot show is traffic that rises and falls over days, scaling on a real queue, or scaling many workloads at once.
Differences with a production setup
- Scaling from zero. KEDA has an HTTP add-on that holds requests while a workload starts, and serving platforms such as KServe include scale to zero. I used neither.
- Signals. A model server’s best signal is often queue length, concurrent requests or GPU use, and KEDA has scalers for many sources. I used one Prometheus query.
- Scale down. I did not compare scale-down behaviour. The HPA’s stabilization window keeps replicas for minutes after load ends, and a cooldown period applies to KEDA when scaling to zero.
- Nodes. Scaling pods only helps if there are nodes to run them on. A node provisioner such as Karpenter adds nodes, which my fixed three do not.
- Cost. Scaling on request rate saves money only if idle replicas can be removed, and for GPU servers a cold start can take minutes.
FAQ
What does KEDA add to the HPA?
It turns signals other than CPU and memory, such as a Prometheus query or a queue length, into external metrics, and it can scale a workload down to zero and up from zero.
Why is CPU a poor signal for some services?
The pods have to become busy first, so it lags, and it ignores waiting work. A service that waits on a database or a GPU can be overloaded with low CPU.
How does the HPA turn a metric into a replica count?
It divides the metric by the target per replica and rounds up. 190 requests per second at a target of 40 asks for 5 replicas.
Why did scale to zero fail when load arrived?
The only signal was the request rate measured by the pods. With zero pods there was no measurement, so the autoscaler could not see demand.
How does this compare with Kueue from the previous post?
Kueue decides whether a batch job may start within a quota. KEDA changes the replica count of a service that is already running. One queues work and the other scales workers.
Next
Take the quiz to test your understanding: Part 5 quiz
The next post in Part 5 delivers changes from a git repository with Argo CD.
Comments