3 Industry usedone · reading only
6 Bare metaldone
Emulated BMCs·Rack power plan·Drift and burn-in·NetBox inventory·Hardening and Secure Boot·Network boot with PXE·RAID and management network
7 Cloud + GPUemulated done · real run pending
AWS autoscaling·GPU fleet monitoring·GPU scheduling·NUMA topology
Goal
Part 6 is about the layer below the operating system. A server in a rack has a baseboard management controller (BMC), a small separate computer that lets you power the machine on and off, read its sensors and update its firmware even when the operating system is not running. A fleet of servers means a fleet of these, and they have to be set up the same way, updated in stages and watched.
I have no rack and no real BMC. What I can do is run emulated ones and practise the operations around them: scripted setup, a staged firmware update, and alerts that catch a controller that hangs, disappears or keeps rebooting. This post covers that. This is the first pass: I plan to repeat it on real hardware later, and the section near the end says what that will involve.
Terms used in this post
- BMC: the management controller on a server board, reachable over the network even when the server is off.
- Redfish: a standard HTTP and JSON interface for managing servers. It is the modern replacement for IPMI.
- IPMI: an older management protocol that BMCs also speak. I did not run it in this post.
- Out-of-band: managing a machine through its BMC and not through its operating system.
- Firmware inventory: the list of firmware components a BMC reports, such as the BIOS and the BMC’s own firmware, each with a version.
- Canary: updating one machine first and checking it before touching the others.
- Health gate: a check that has to pass before a rollout continues.
- Flapping: something that keeps going down and coming back.
- Hung: a service that accepts a connection and then never answers.
What I built
- Six emulated BMCs. The DMTF Redfish mockup server, one process per node, each serving its own copy of a rack-mount server mockup over TLS with a self-signed certificate.
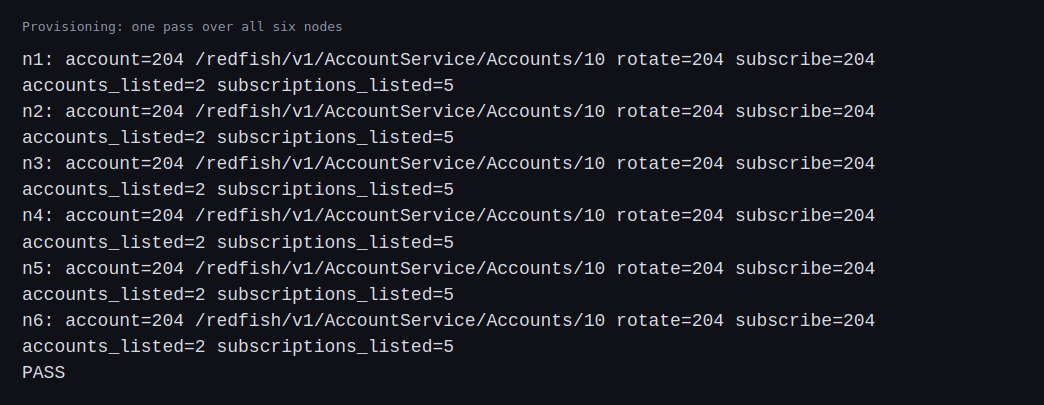
- A setup script. For every node it creates a service account, rotates the password of the default administrator, registers an alert destination, and then reads each change back.
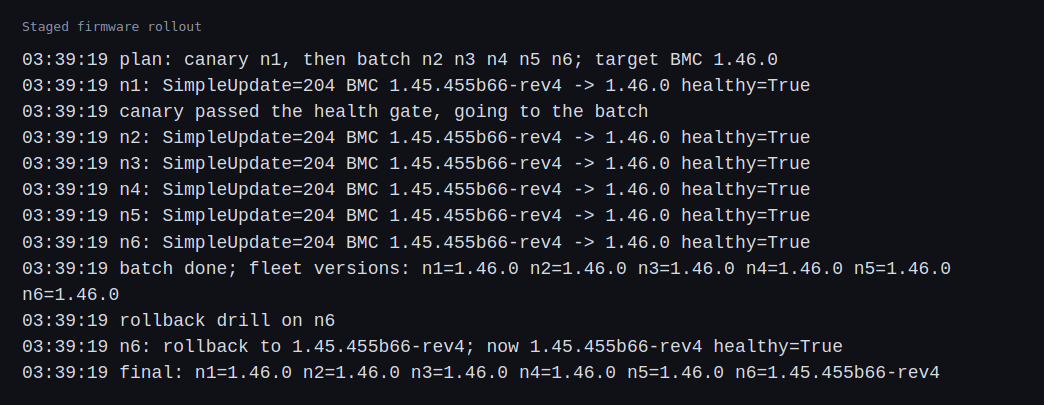
- A staged firmware rollout. One canary, a health check, then a batch of five, then a rollback on one node.
- An exporter. A small program that probes each BMC on every scrape, with a 2 second timeout, and publishes whether it answered, how long it took, why it failed, and its power state, health, temperature and firmware versions.
- Prometheus with three alerts. A BMC that refuses connections, a BMC that accepts the connection and does not answer, and a BMC whose state changed three or more times in a minute.
- Drills. A script that freezes a process, kills one, or kills and restarts one in a loop, and records when each alert became pending and firing.
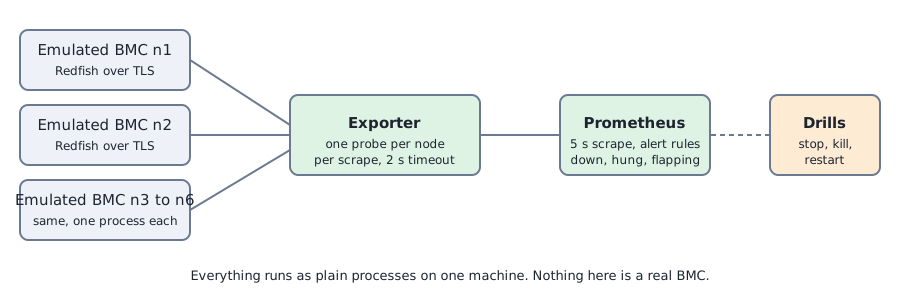
How it works
Each emulated BMC answers the same Redfish paths a real one would, such as the system resource, the account service, the event service and the update service. A real management tool could talk to it. That is also the limit: the mockup returns what is in its files and keeps changes in memory. It does not enforce logins, it does not apply a firmware image, and a process that is killed and started again forgets everything it was told.
The setup script is a series of calls with a read-back after each one. It creates an account with a POST, changes the default account with a PATCH, and registers an event destination with a POST. A change is only counted when reading it back shows it.
The rollout script follows the sequence a real rollout would: update the first node, check it is healthy and powered on, continue with the rest only if that holds, and keep the previous version of each node so that a rollback is one call. The mockup accepts the update request with a 204 but applies nothing. To model the result, the script then sets the firmware version in the inventory. That tests the order of steps and the checks, and nothing about flashing.
The exporter makes one probe per node on every scrape and records the reason when one fails. That reason matters because a refused connection and a timeout mean different things. Refused means nothing is listening, so the process or the machine is gone. A timeout means something accepted the connection and did not answer, which is what a hung controller looks like. The three alerts are written around that split.
Commands and results
The setup script passed on all six nodes. Each got the new account, a rotated default password and an event destination, and each change was confirmed by reading it back.
The rollout took the canary to the new BMC firmware version, passed the health gate, moved the other five, and then rolled one node back to its old version.
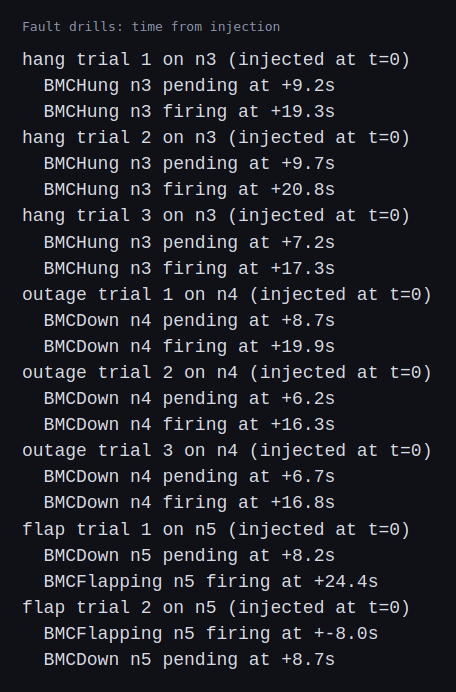
For the drills I used alerts that wait 10 seconds before firing, and measured from the moment I injected the fault. Times are the first moment Prometheus showed the alert as pending and as firing.
- Hung (process frozen for 45 seconds): pending after 9.2, 9.7 and 7.2 seconds, firing after 19.3, 20.8 and 17.3 seconds.
- Down (process killed for 45 seconds): pending after 8.7, 6.2 and 6.7 seconds, firing after 19.9, 16.3 and 16.8 seconds.
- Flapping (four cycles of 7 seconds down and 7 seconds up): the flapping alert fired 24.4 seconds after the first fault. The down alert only reached pending, because no outage lasted the 10 seconds it needs. One trial is valid. In the second trial the flapping alert was still active from the first, so it gave no detection time and I left it out.
The timeline below is drawn from Prometheus data for all the drills. Orange is a timeout, red is a refused connection, and the dark marks show where an alert started firing.
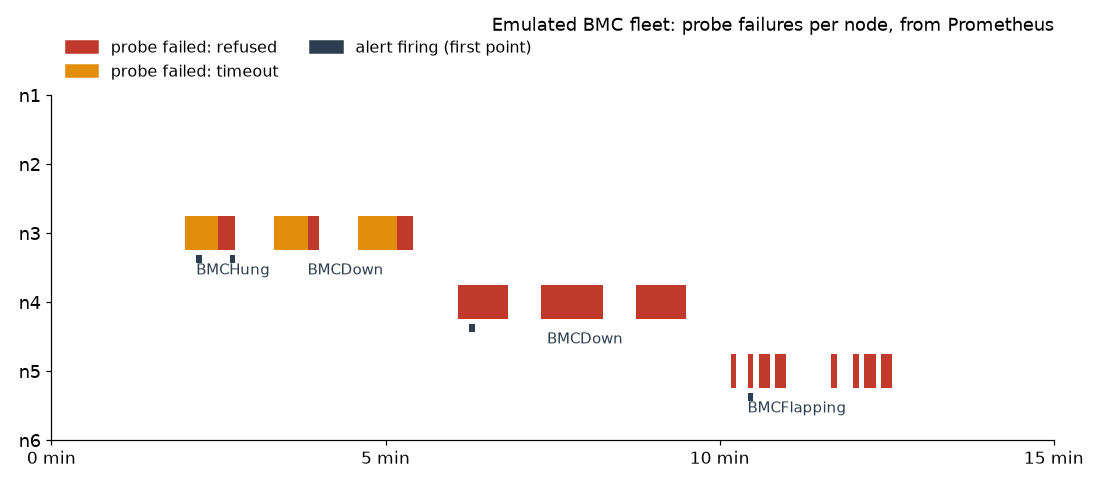
The numbers come from a 5 second scrape, a 10 second alert delay and a 2 second timeout that I chose, so they say how my settings behave and not how long a real fleet takes to notice.
Challenges
- A short outage is invisible to a down alert. With a 10 second delay, a controller that drops out for 7 seconds, comes back and drops out again never makes the down alert fire. In a real fleet that is a controller that is rebooting in a loop, which is the thing you most want to hear about. A separate alert on the number of state changes caught it. The cost is a longer window to define and tune.
- A hang can raise the down alert too. In two of the three trials the down alert fired for 5 seconds, which I read as happening near the end of the freeze. The mock BMC is a single-threaded Python server, and Python’s socketserver holds up to 5 waiting connections by default, after which further connections are not accepted. While the process was frozen, the first probes were accepted into that queue and timed out waiting for an answer, which is what the hung alert catches. Once the queue was full, new connections timed out while connecting. My exporter labels every
requestsconnection error asrefused, and the library’s connect timeout is a kind of connection error, so those probes counted as down. I reproduced it with one mock BMC frozen for 16 seconds and probed continuously with a 2 second timeout: six probes timed out waiting for an answer, two timed out connecting, and the first answer came 1 second after the process was unfrozen. One fault can raise two different alerts in a row, and a runbook has to expect that. - Alerts overlap between runs. A flapping alert from one trial was still active when the next one started, which made the second measurement unusable. A drill needs a wait until everything has cleared, or a way to tell the runs apart.
Differences with a production setup
- Real controllers. Production BMCs run firmware such as OpenBMC or a vendor’s own, and they have real logins, certificates, rate limits and update behavior that a mockup does not have.
- Standards. Redfish is the DMTF standard I used. Many fleets still need IPMI for older machines.
- Monitoring. Production setups use exporters such as the Redfish exporter and the IPMI exporter, with Alertmanager to route and group alerts. I only looked at alert states in Prometheus.
- Provisioning. Bare-metal tools such as MAAS or OpenStack Ironic drive the BMC to boot and install machines. I did not run either one in this post.
- Firmware. Real updates are staged by vendors’ tooling, with signed images, reboots, and rollbacks that can fail. My rollout only models the order of the steps.
- Network. Production BMCs sit on a separate management network. Mine are local processes.
- The mockup. I used the DMTF Redfish mockup server, which is meant for testing clients, not for imitating a controller’s behavior.
FAQ
What is the difference between a BMC and the operating system on a server?
The BMC is a separate small computer on the board with its own network port. It works when the server is off or the operating system has crashed, which is why power control and firmware updates go through it.
Why does the exporter record why a probe failed?
A refused connection and a timeout need different responses. Refused points at a dead process or a machine without power. A timeout points at a controller that is up but stuck, which sometimes needs a reset through another path.
Why roll out firmware to one node first?
A bad image can leave a controller unreachable. If that happens to one node, the others still have a working management path to recover it. The health gate is what stops the rollout from continuing.
Why did the down alert not fire during the flap drill?
Each outage lasted 7 seconds and the alert needs 10 seconds in a row. That is the reason for a second alert on the number of state changes.
What will change the most between the emulated BMCs and real ones?
Timing and failure behavior. A real BMC enforces logins, takes minutes to flash and reboot, and sits across a network that can delay or drop its answers, so the alert timings and the update steps will need to be measured again.
Repeating with real hardware
Coming soon. When I have a server with a real BMC, I will run the same setup script, rollout and drills against it and compare the detection times and failure behavior with the emulated numbers here, including a real login, a real flash and a real reboot.
Next
Take the quiz to test your understanding: Part 6 quiz
Part 6 continues with a paper exercise on power for a rack, then with checks on the VMs that already exist: drift detection and a burn-in.
Comments