Goal
Servers with more than one CPU socket do not have one flat pool of memory. Each socket has memory attached to it, and a core reaches its own socket’s memory faster than the other socket’s. Each socket with its local memory is a NUMA node. GPU servers make this matter more, because each GPU hangs off a particular socket, and a job that runs on the wrong socket pays for it on every transfer.
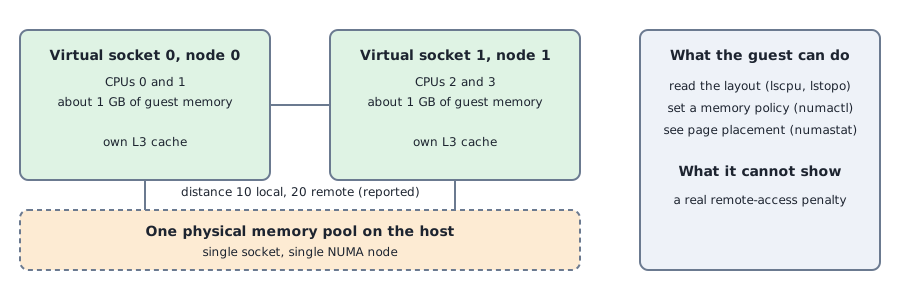
The lab host is a single-socket machine with one NUMA node, so there is no real penalty to measure here. What I can do is give one VM two virtual sockets and two NUMA nodes, and practice everything around it: reading the layout, setting memory policies, watching where pages land, and seeing what the scheduler does or does not do with the topology. The measurements show how the tools behave. They say nothing about what a remote access costs on real hardware.
Terms used in this post
- NUMA: non-uniform memory access, where memory access time depends on which CPU asks and which memory it reads.
- NUMA node: a group of CPUs and the memory closest to them.
- Remote access: a CPU reading memory that belongs to another node.
- Node distance: a number the firmware reports for each pair of nodes, where 10 means local and larger means farther.
- First touch: the default policy, where a page is placed on the node of the CPU that first writes to it.
- Memory policy: a rule for where a process’s pages go, such as bind to a node, or interleave across nodes.
- Interleave: spreading pages round-robin across nodes.
- CPU affinity: the set of CPUs a process may run on.
- cpuset: the cgroup control that limits which CPUs and memory nodes a group of processes may use.
- hwloc: a library and tools, such as
lstopo, that print the machine’s hardware layout.
What I built
- One VM with two virtual sockets. Two sockets of two cores, NUMA enabled, 2 GB of memory split across the nodes, created from the same Debian 12 template as the other lab VMs.
- A reading drill.
lscpu,numactl --hardwareandlstopoon the guest, and the per-node memory files under/sys. - A bandwidth test. A single-thread memory read test with the CPU node and the memory node chosen independently, in all four combinations.
- A placement test. A process that touches 400 MiB under three policies, with
numastatshowing where the pages ended up. - A Slurm check. CPU binding flags run on the existing two-node cluster, which has one NUMA node per machine.
How it works
The hypervisor tells the guest firmware how many nodes there are, which CPUs belong to each and how much memory each has. The guest kernel reads that and builds its own idea of locality: it prefers to allocate a page on the node of the CPU that touched it, and it keeps per-node free lists. numactl changes that policy for a command, either by limiting the CPUs a process may use or by limiting or spreading the nodes its pages may come from.
The distance table is only as good as what the hypervisor reports. Mine said 10 for local and 20 for remote, which are default values, so the table describes nothing about the physical machine. On real servers the firmware fills the table from the actual interconnect.
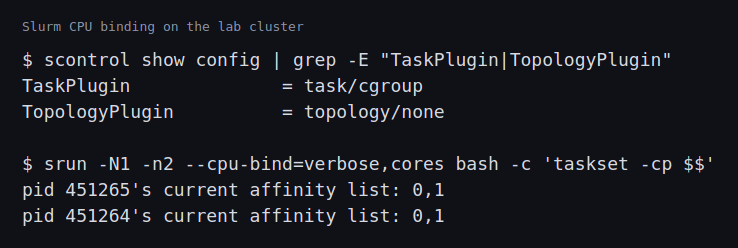
For schedulers, Slurm places a task on CPUs through a task plugin. Its documentation says the --cpu-bind option applies only when the task/affinity plugin is enabled, and the lab cluster runs task/cgroup alone.
Commands and results
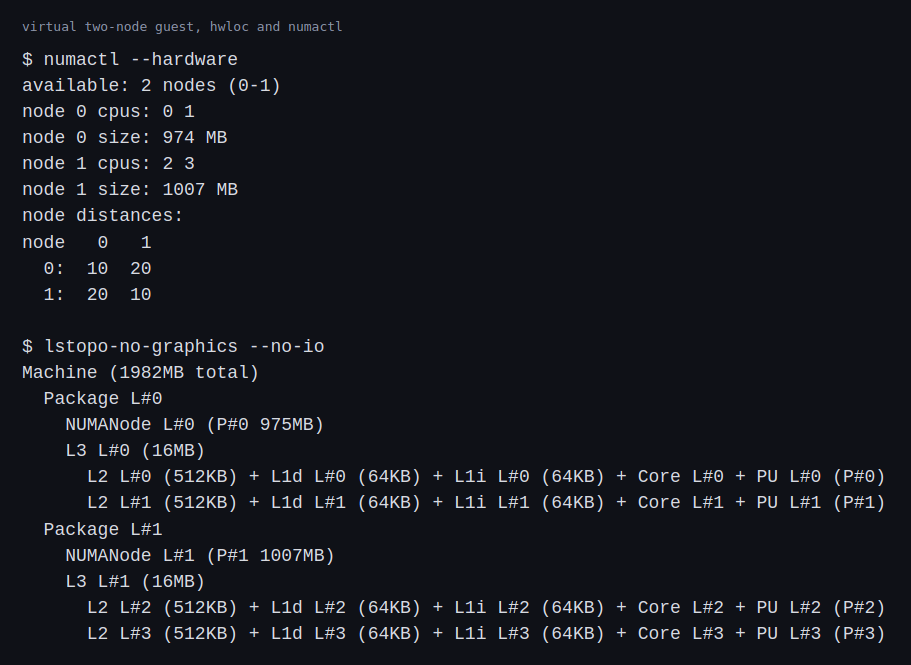
The guest reported two nodes with two CPUs and about 1 GB each, two packages, and a separate L3 cache for each node. The distances were the default 10 and 20.
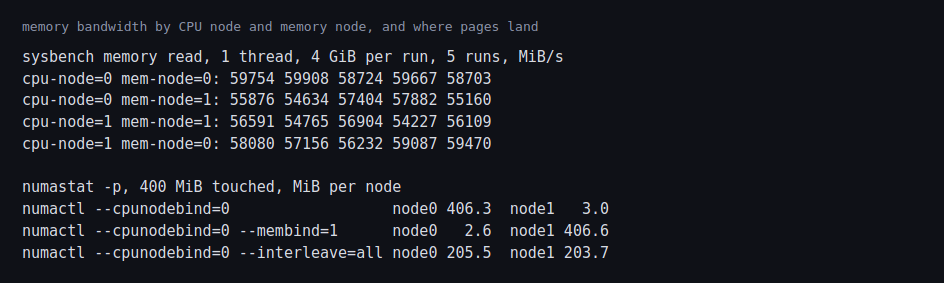
For bandwidth, I ran a single-thread read test with every combination of CPU node and memory node, five runs each. Memory on node 0 averaged about 59,350 MiB/s from CPU node 0 and 58,000 MiB/s from CPU node 1. Memory on node 1 averaged about 56,200 MiB/s from CPU node 0 and 55,700 MiB/s from CPU node 1. Memory on node 1 was about 5 percent slower from both CPU nodes. A real remote penalty would make the local combination the fast one for each CPU, so this does not look like locality. The host has one memory pool behind both nodes, so the 5 percent most likely follows how the host backs that part of the guest’s memory and not any distance the guest can see (my inference).
For placement, the default policy put 406 MiB of a 400 MiB working set on the node where the process ran. Bound to the other node, 407 MiB landed there instead. Interleaved, the pages split 205 and 204 MiB. Placement worked the way the policy says, and numastat -p makes it visible.
For Slurm, --cpu-bind=verbose,cores printed nothing and the two tasks reported the same affinity list, both CPUs. The flag was accepted and had no effect. I did not change the cluster’s Slurm configuration, so what turning binding on would look like is a prediction: adding task/affinity to TaskPlugin should make the same command print a binding for each task and give each task its own CPU.
Challenges
- The scheduler may not use topology at all. A job asked for binding and got none, with no error. On a GPU node that means a job can run on the socket farthest from its GPU while the job script looks correct. Checking the effective affinity of a running task is part of acceptance testing for a node.
- First touch decides placement. A process that allocates memory on one thread and then runs on another socket keeps its pages on the first node. Pages stay where they were first written unless the kernel migrates them, and the symptom is a job that is slower on some nodes of a fleet than on others.
- Default topology data can mislead. The 10 and 20 distances came from defaults. Firmware or hypervisor settings that report wrong values make every tool agree with the wrong picture.
- Noise hides small effects. Five runs per combination gave spreads of a few percent, and the difference I saw between nodes did not follow locality. A node health check that compares bandwidth needs enough runs, and a threshold above the noise.
- A real remote penalty cannot be shown here. There is one physical memory pool, so the cost of remote access, and the extra cost when a GPU is on the other socket, need multi-socket hardware. In the future I’m planning to purchase a hardware kit to help practice further.
Differences with a production setup
- Hardware. Real servers have two or more sockets, and the firmware describes the real distances through the ACPI tables. The Linux kernel documents how it uses that data in its memory performance attributes guide. QEMU’s NUMA options, including the distance table, are in its invocation reference.
- Hypervisor. The QEMU manual describes how a guest’s NUMA nodes are defined:
-numa nodeassigns memory and virtual CPUs to a node and-numa distsets the distance between two nodes, which is where the table the guest prints comes from. The Proxmox NUMA option I used asks QEMU for such a topology. Production virtualization usually pins virtual CPUs and memory to host nodes so the guest topology matches the hardware. - Policies.
numactlhas more modes than I used, listed in its manual page. Production jobs often set them through the scheduler instead. - Scheduling. Slurm’s task plugins and binding options are in the srun documentation, and
cgroup.confoptions for cpusets are in the cgroup.conf documentation. Production GPU nodes also map each GPU to the CPUs closest to it in the scheduler’s GPU configuration. I did not run that here. - Kubernetes. Production clusters can align CPU, memory and device allocation to nodes with the kubelet’s topology manager. This lab has one node per machine, so I did not try it.
FAQ
What is a NUMA node?
A set of CPUs together with the memory attached to them. Access inside a node is faster than access to another node’s memory.
Why do GPU servers care?
Each GPU and network card is attached to one socket. A job whose CPU threads run on the other socket pays extra on every transfer to the GPU.
Why did the distances say 10 and 20?
They are default values the hypervisor reports. Real firmware reports measured values.
What does first touch mean?
A page goes on the node of the CPU that first writes to it. Where a process starts allocating decides where its data lives.
Why did --cpu-bind do nothing?
The cluster uses only the cgroup task plugin, and the srun documentation says the option applies when the affinity plugin is enabled.
What will change the most between these virtual nodes and real hardware?
The size of the remote memory penalty and where the GPUs sit. The two nodes here sit over one memory pool, so the real latency difference, GPU placement and Kubernetes topology alignment will change the answers most.
Repeating with real hardware
Coming soon. On a multi-socket server with GPUs, I will measure local against remote bandwidth and latency, check which socket each GPU belongs to, turn on binding in the scheduler, and compare a job placed next to its GPU with one placed away from it.
Next
Take the quiz to test your understanding: Part 7 quiz
The next part, Part 8, is reading and diagrams only: how GPUs connect inside a server, with NVLink and NVSwitch.
Comments