Goal
A machine is never finished when it is first set up. Over time someone edits a file by hand, a service gets stopped during a debugging session, or a setting changes at runtime and is lost at the next reboot. In a fleet this is called drift, and the fix is to describe the intended state once, check against it regularly, and treat a difference as a finding.
Before a machine goes into service there is also a different question: is the hardware sound? Commissioning answers it with a burn-in, which is a deliberate stretch of heavy load on the processor, memory and disk, and a short acceptance report that says pass or fail against thresholds written down in advance.
This post does both on the lab’s virtual machines.
Terms used in this post
- Drift: a difference between what a machine is supposed to look like and what it looks like now.
- Baseline: the written description of the intended state, here an Ansible playbook.
- Check mode: running a playbook so that it reports what it would change without changing it.
- Idempotent: safe to run repeatedly, with no change after the first run.
- Remediation: bringing a drifted machine back to the baseline.
- Burn-in: running heavy load for a fixed time to find early failures.
- Acceptance report: a record of burn-in and other checks against thresholds, ending in pass or fail.
- Bogo-ops: the work counter that the stress tool reports. It has no unit outside the tool, so only comparisons on the same machine mean anything.
What I built
- A read-only check of the three cluster nodes. The playbook that built them, the
commonrole for identities, keys, name resolution, cloud-init and time sync, run with check mode and diff output. - A baseline for the demo VM. A separate playbook with six managed settings of the kind that drift: an SSH access rule file, a kernel setting, time sync installed and running, a login banner, and a small health check script.
- A drill. A script that makes five changes by hand on the demo VM, runs the check, and then fixes them with a real run.
- A scheduled check and a latency test. A loop that runs the check every 30 seconds, and three trials that change things at different points of its cycle.
- A burn-in and acceptance script. It runs a processor stress, a memory test, a disk test and a kernel log check, and prints a report that ends in pass or fail. Thresholds can be changed from the command line.
I kept the deliberate changes off the three cluster nodes, which run the cluster, and used the demo VM that the earlier infrastructure-as-code post created. The checks on the cluster nodes only read.
How it works
Check mode asks each task in the playbook whether it would change anything. A file task compares content, mode and owner, and with diff output it prints the difference. A service task compares the running state. The kernel setting task compares both the file and the live value, so a setting changed with a command and not in the file still counts.
Because the playbook describes the intended state and nothing else, anything it does not mention can drift without being seen. That is the central limit of this approach, and it makes the choice of what to put in the baseline an important one.
The check loop is a few lines of shell. It runs the playbook in check mode, takes the number of changed tasks from the summary, and prints the time and that count. A count of zero means no drift. The time to notice something is set by how often the loop runs and how long one check takes.
The acceptance script runs on the machine itself. The processor test runs the stress tool on all cores for a set time and compares the work counter with a minimum. The memory test locks and checks a block of memory. The disk test runs random reads and writes with direct I/O and compares the rate and the slowest 1 percent of operations with limits. The last check counts error lines in the kernel log, such as I/O errors, out-of-memory kills and call traces. Every limit is written in the script and can be overridden, so the report always says what it was compared with.
Commands and results
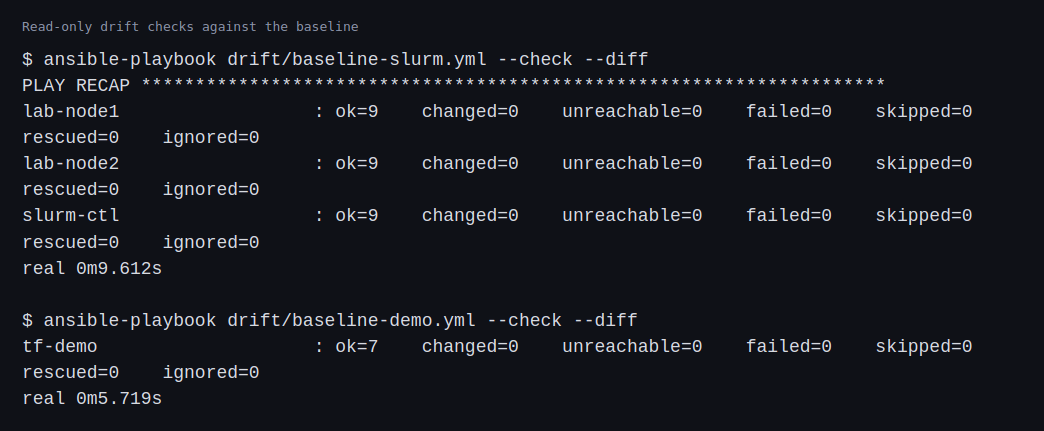
The three cluster nodes matched their baseline: no changed tasks on any of them, and the check took about 10 seconds for all three. The demo VM, after its baseline was applied, was also clean, in under 6 seconds. Applying it the first time changed six things, including installing the time sync package.
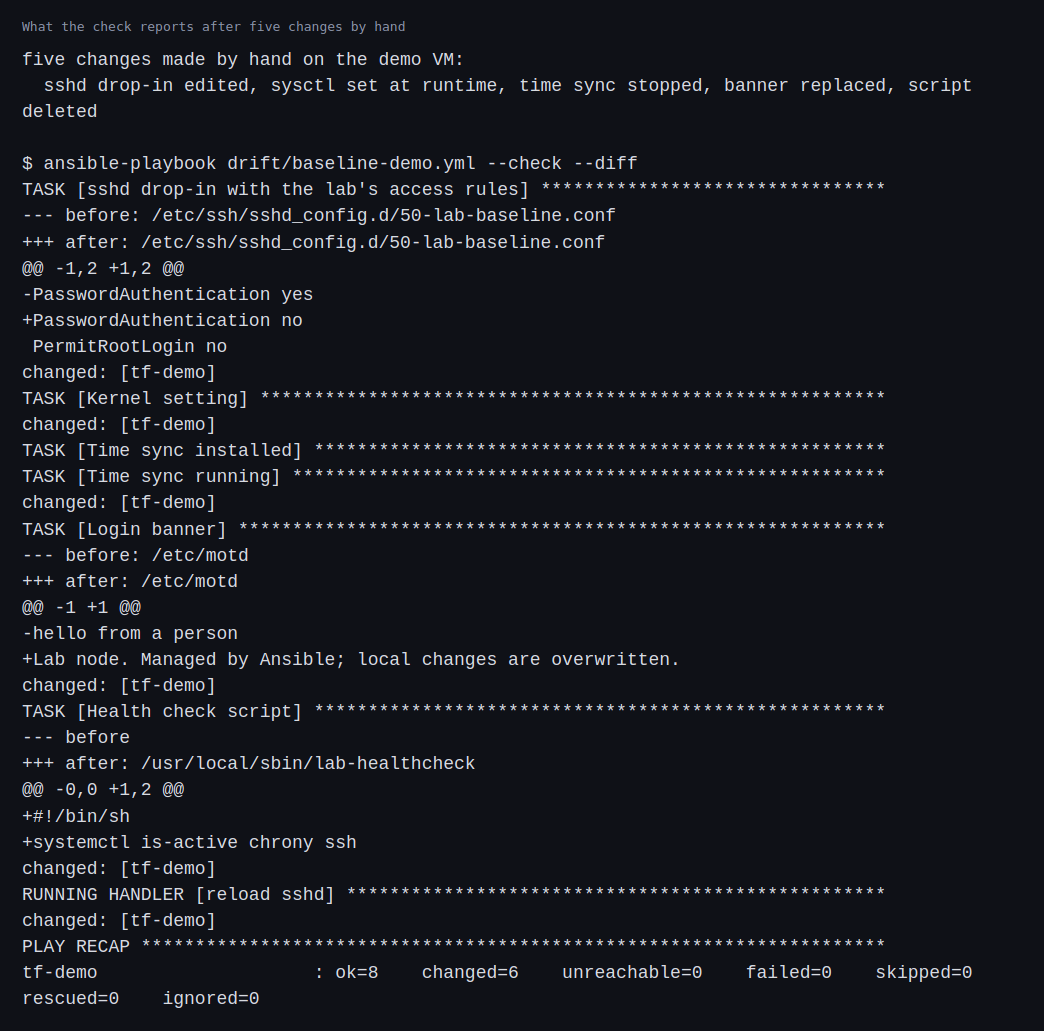
Then the drill. I made five changes on the demo VM by hand: I edited the SSH rule file, set the kernel value at runtime without touching its file, stopped time sync, replaced the login banner and deleted the health check script. The next check reported six changed tasks, which is the five plus the step that reloads the SSH service because the rule file changed. The file tasks print a diff of exactly what differs. The kernel and service tasks report that they would change but print no diff, so the report says what, and a person has to look at the machine for how. A real run then fixed all six in 6 seconds, and the check afterwards was clean.
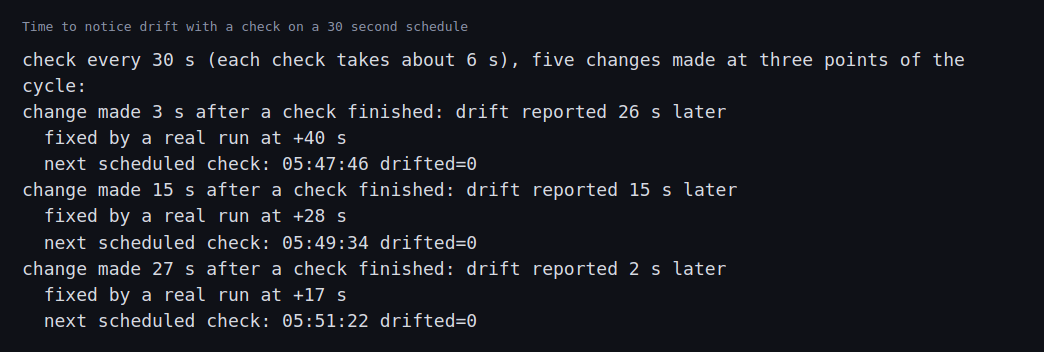
To see how fast a scheduled check notices, I ran the check every 30 seconds, which with the 6 second run is about a 36 second cycle, and made the same five changes at three different points of it. The check reported the drift 26, 15 and 2 seconds later. The wait depends on where in the cycle the change lands and cannot be longer than one cycle. Each time, a real run restored the baseline and the next scheduled check was clean.
The acceptance run on the demo VM, which has one virtual processor and about 1 GB of memory, ran for about four minutes. The processor stress ran for 120 seconds at 1,933 bogo-ops a second, the memory test passed one pass over 256 MB, the disk test did 12,202 operations a second with a 99th percentile latency of 0.1 ms, and the kernel log had no errors. All four checks passed. To see a failure I ran the same script for 10 seconds each with thresholds that no machine could meet, and it reported FAIL for the processor and the disk and exited with a non-zero status, which is what a pipeline would act on.
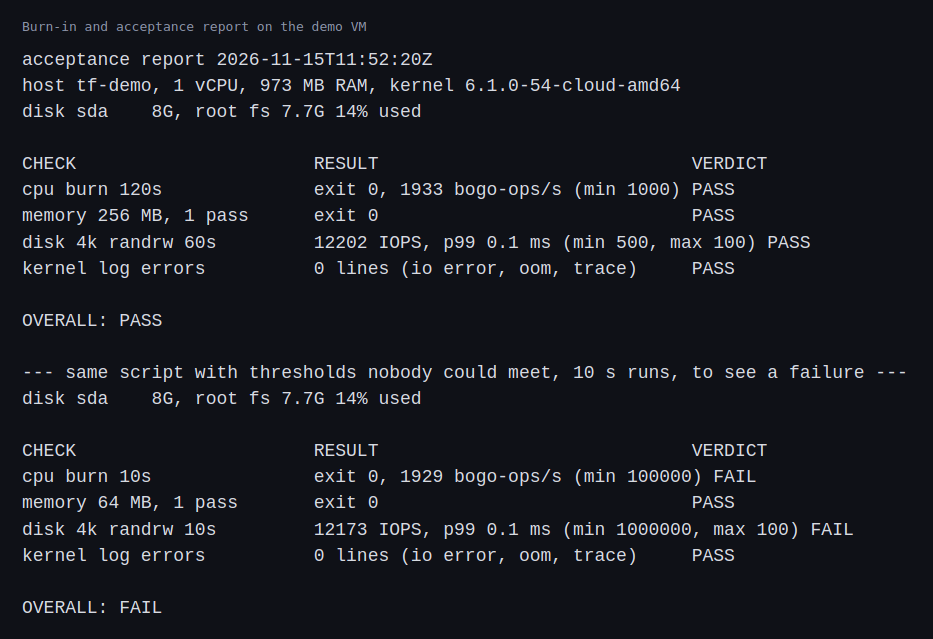
The disk figures describe the virtual disk and the host’s caching, not a physical drive, and the processor figure only means something compared with another run on the same VM.
Challenges
- A check shows what, not always how. Some tasks print a diff and some only say they would change. For a service stopped by hand or a kernel value changed at runtime, a person still has to log in to see the cause. A drift report is a list of findings and not an explanation.
- Detection time is set by the schedule. The three trials took 26, 15 and 2 seconds, and with this schedule the worst case is one cycle of about 36 seconds. A faster check costs more load on the machines and the controller, and a slower one leaves drift unseen for longer.
- What the baseline does not describe cannot drift visibly. The five changes I made were all things the playbook manages. A change to something it does not mention, such as a new user or an opened port, would pass every check. The baseline has to grow with what matters.
- Virtual hardware hides what burn-in is for. Memory and disk tests on a VM test the virtual layers and the host that backs them. A failing memory module or a disk with bad sectors would not show up. The burn-in matters on real machines, and here it shows only the method.
- I kept the load off the cluster nodes. Running a heavy burn-in on a node that is part of a working cluster would affect the work on it, and one of them was already using most of its memory. A burn-in belongs before a machine joins service, not after.
Differences with a production setup
- Configuration management. Production fleets run a baseline from a central controller such as AWX, the open source base of Ansible’s automation platform, or with agents from tools like Puppet, on a schedule, with reports and alerts.
- Check mode. The mechanism is described in the Ansible documentation on check mode. Not every module supports it equally, so a clean check is evidence and not proof.
- Burn-in tools. Real burn-in uses tools like stress-ng, memtester and fio for hours or days, together with temperature, power and error counters from the hardware. I ran each for minutes on a virtual machine.
- GPU nodes. GPU servers add their own diagnostics and long-running tests, which belong to Part 7 and which I have not run.
- Hardware checks. Real acceptance also reads memory error counters, disk health data and fan and temperature sensors, and it is usually driven through the BMC and the vendor’s tools. A virtual machine has none of these.
- Policy. A production baseline usually includes a security standard such as the CIS benchmarks, which a later post covers.
FAQ
What is the difference between drift and an incident?
An incident is a failure that affects service. Drift is a quiet difference that has not broken anything yet, and finding it early is the point.
Why run in check mode and not just run the playbook?
Running the playbook would fix the difference without anyone knowing it existed. Check mode reports the difference, which is the evidence that something changed things by hand.
Why did five changes show as six?
The change to the SSH rule file also triggers the step that reloads the SSH service, and check mode counts that step as changed too.
What does idempotent mean here?
The playbook can run any number of times and only changes what is different. The first run on the demo VM changed six things, and the check after it changed none.
Why does a burn-in run for hours on real hardware?
Many faults show up only under sustained load or heat, such as a marginal memory module or a fan that slows down. Short runs miss them.
What would make this check stronger?
A wider baseline, results sent to monitoring so that a drift raises an alert, and a decision on how long a machine may stay drifted before it is fixed or rebuilt.
Repeating with real hardware
Coming soon. When I have a real server, I will run the same acceptance script on it for hours, add temperature, power and memory error counters and disk health data to the report, and check the baseline against the machine after it has been through a reboot and a firmware update.
Next
Take the quiz to test your understanding: Part 6 quiz
Part 6 continues with an inventory of the rack and the machines in NetBox, and onboarding and offboarding a node.
Comments