Goal
A GPU fleet fails in ways that a CPU fleet mostly does not. A card can run at a fraction of its speed because it is too hot or hitting a power limit, and the job on it just gets slower with no error. A card can report a driver error. A card can drop off the bus and disappear from the machine. And an expensive card can sit idle for hours while it is reserved for someone.
I do not have GPUs, and this part is not spending money on any, so I built the monitoring side against an emulated fleet. The exporter exposes the metric names a real GPU telemetry exporter uses, with values from a model, and a control file lets me switch faults on. I wrote four alert rules and timed how fast each one fires.
Terms used in this post
- GPU telemetry: readings from a GPU such as utilization, clock speed, temperature, power and memory use, and error counters.
- Exporter: a small program that exposes readings in a format Prometheus can scrape.
- SM clock: the clock speed of the GPU’s compute units. It falls when the card is throttled.
- Clock throttling: the card lowering its clock because of heat, a power limit or another reason.
- XID error: a numbered error that the NVIDIA driver reports when something goes wrong with a GPU.
- Falling off the bus: a GPU that stops responding on the PCIe bus and vanishes from the machine.
- Idle while allocated: a GPU that is reserved for a job and doing nothing, which wastes its cost.
- Alert rule: a Prometheus expression that becomes an alert when it stays true for a set time.
- Pending and firing: an alert is pending while its condition holds but the wait is not over, and firing after it is.
What I built
- An emulated fleet. Eight GPUs on two nodes, four each. Each reports utilization, SM clock, temperature, power, memory used, the last XID error and a throttle reason. The values come from a model of a busy training job.
- A control file. It puts one GPU into a fault state: capped, driver error, missing or idle.
- Four alert rules. A busy GPU whose clock is below 70 percent of its maximum, any driver error, a node that reports fewer than four GPUs, and a GPU whose average utilization over a minute is below 10 percent.
- Drills. A script that switches a fault on for one GPU, waits for the alert, switches it off, and records when the alert became pending, when it fired and when it cleared.
- A timeline. A picture of each GPU’s state across all the drills, drawn from Prometheus.
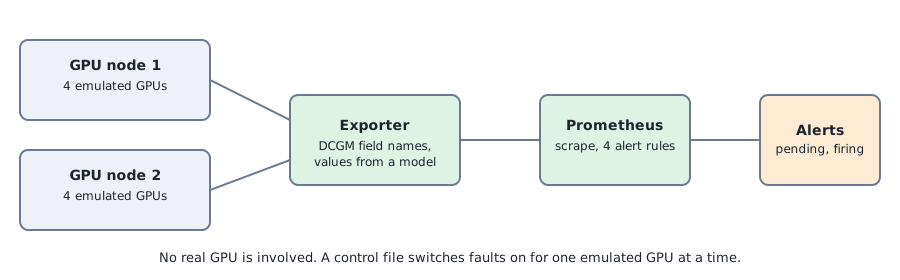
How it works
The exporter has no GPU behind it. For each GPU it reports numbers drawn at random within a range that looks like a busy card, with the metric names and labels of a real GPU exporter, so that the rules I write could be moved to a real fleet. A fault changes the numbers. A capped GPU keeps its high utilization but its clock drops to about 800 MHz, its temperature rises and its power falls. A driver-error GPU reports an error value and almost no work. A missing GPU is not reported at all. An idle GPU reports almost no utilization and little memory.
The rules are written around what each fault looks like in the data. The clock rule needs a low clock and high utilization together, because an idle card has a low clock too and that is normal. The missing-GPU rule counts the GPUs each node reports and fires below four, since a card that has fallen off the bus has no series to alert on. The idle rule averages over a minute so that a short pause between jobs does not fire it.
Every rule waits before it fires, so a single odd reading does not wake anyone. The delay is the price of that, and the drills measure it.
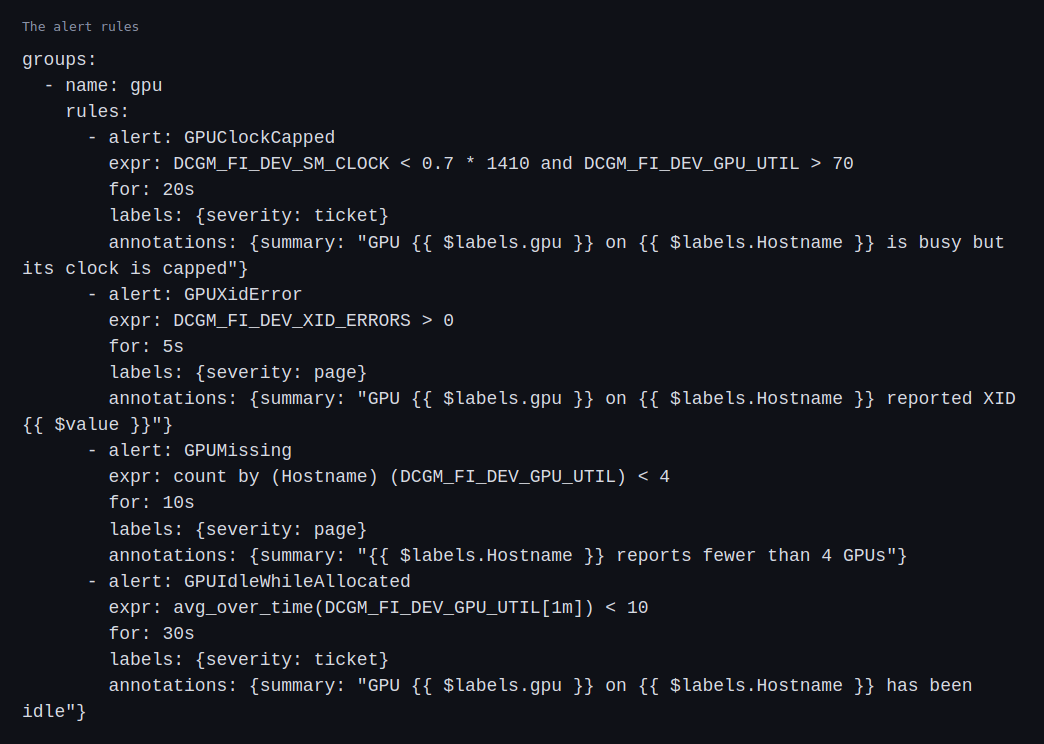
Commands and results
I ran each fault several times on the same GPU and recorded the times after the fault started. The clock cap was pending after 3.5 to 5.6 seconds and firing after 23.8 to 26.7 seconds, which is the 20 second wait plus the scrape and evaluation intervals. The driver error was pending after 3.5 to 9.1 seconds and firing after 8.6 to 14.1. A missing GPU was pending after 3.5 to 9.6 seconds and firing after 13.6 to 19.7. The idle alert took much longer, pending after about 56 and 61 seconds and firing after about 86 and 92, because its minute-long average has to fill with idle readings first. All of them cleared a few seconds to about 17 seconds after the fault was removed.
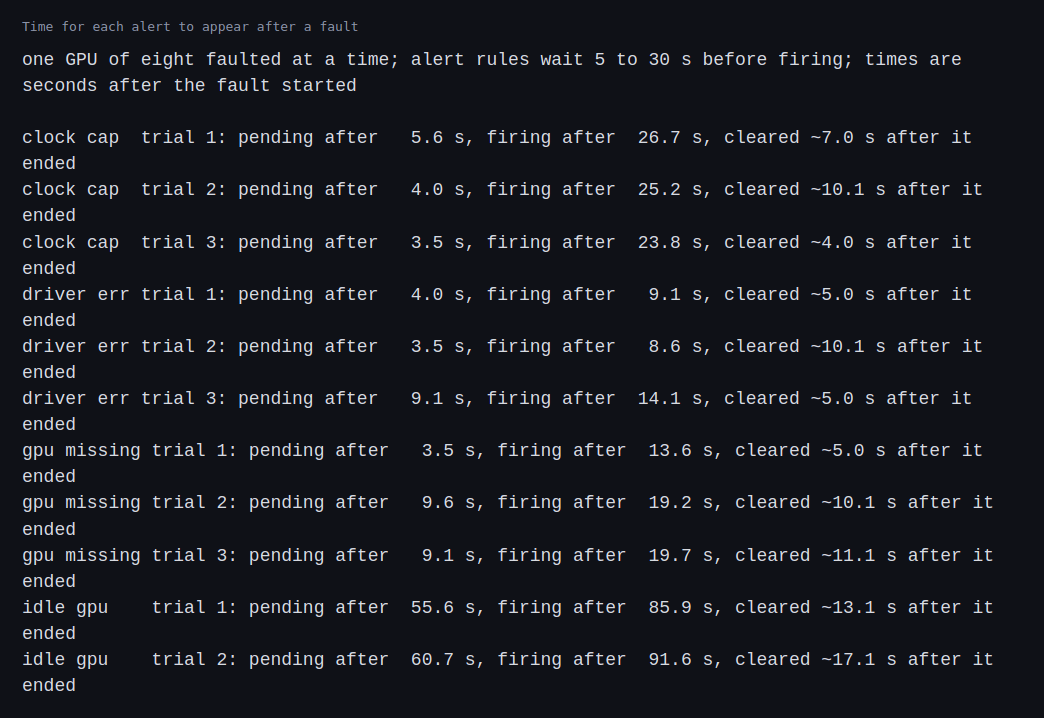
The timeline shows the same drills as states per GPU. One GPU went through three clock caps, three driver errors, three disappearances and two idle periods while the other seven stayed healthy.
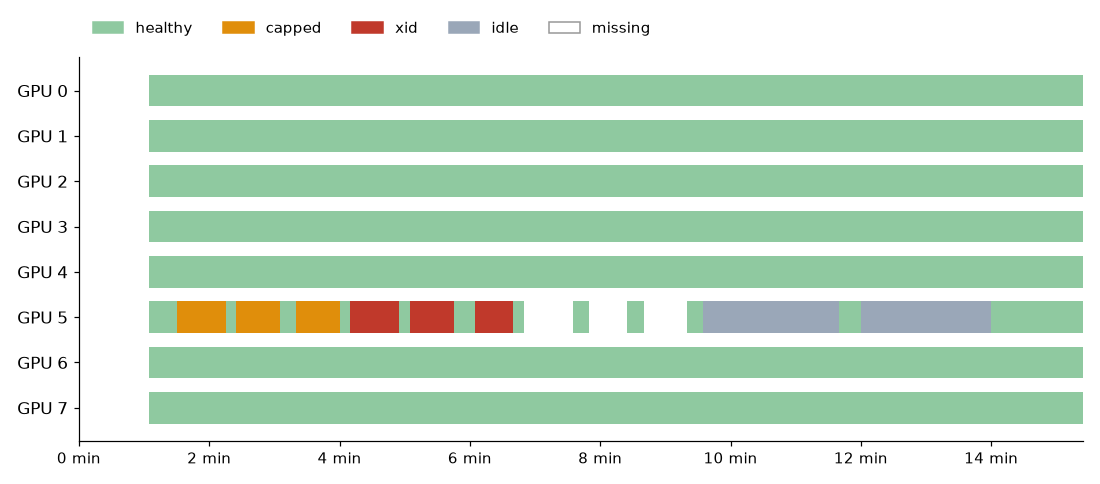
The numbers describe my rule settings and the 5 second scrape and evaluation intervals. The thresholds, such as 70 percent of 1410 MHz, were chosen for the emulated GPU.
Challenges
- The alert delay is a trade-off. The clock-cap alert took about 25 seconds and the idle alert about 90. A shorter wait fires sooner and also on noise. For a GPU, where a job may be hurt for minutes before anyone looks, the more important choice is what each alert does and who it goes to.
- A GPU that is gone has nothing to alert on. Alerting on a metric does not work when the metric disappears. The missing-GPU rule counts series per node and needs to know the expected number. I wrote four into the rule, and a real fleet should take it from its inventory.
- A low clock is not always a problem. An idle GPU runs a low clock on purpose. The clock rule only fires when utilization is high too, and getting that join wrong either floods the pager or hides the failure.
- Idle detection needs a window. A minute is short for real work, where jobs pause for data. A real rule would use a longer window, and its alert would take correspondingly longer.
- The monitoring is itself a service. If the exporter dies, every series disappears at once, and the missing-GPU rule would fire for every node. That case needs its own alert on the scrape itself.
Differences with a production setup
- Real telemetry. The usual exporter is NVIDIA’s dcgm-exporter, which reads from DCGM. It is typically deployed on Kubernetes by the GPU Operator. I borrowed the field names and wrote the values myself.
- Real faults. The meaning of each driver error is documented in NVIDIA’s XID error reference. I used one error value as an example and did not check how a real card behaves.
- Routing. Alerts go to Alertmanager, which groups, silences and routes them. I only looked at alert states in Prometheus.
- Diagnostics. Production teams also run active diagnostics before and after a failure, such as DCGM’s tests, which I have not run.
- Cost. A real fleet turns idle time into a cost report per team or job. I only fired an alert.
- Scale. Eight GPUs and a 5 second scrape are small. Large fleets tune scrape intervals, retention and label cardinality for thousands of GPUs.
FAQ
What does a clock cap mean for a job?
The GPU is running slower than it should, and the job takes longer, usually without any error. It is one of the harder GPU problems to notice without a metric.
Why alert on missing GPUs by counting?
When a GPU drops off the bus it stops reporting, so there is no value to compare with a threshold. Counting what is reported and comparing it with what is expected catches the absence.
Why average utilization for the idle alert?
So that a pause between jobs does not fire the alert. The cost of the window is that the alert is slower.
What is an XID error?
A numbered error from the NVIDIA driver. Different numbers mean different problems, from a recoverable application fault to a failing card.
Why emulate the fleet?
To write and test the alerts without a GPU, so that the rules are ready when real hardware is available.
What will change the most between the emulation above and the real GPUs?
The values the GPUs report. A real card reports its own clocks, temperatures and error counts, so the thresholds chosen for the emulated card will need to be set again from real data, and the rules tested against a real exporter.
Repeating with real hardware
Coming soon. When I have access to real GPUs, I will deploy the real exporter, compare its metric names and values with the emulated ones, induce a clock cap with a power limit, and time the same alerts.
Next
Take the quiz to test your understanding: Part 7 quiz
Part 7 continues with scheduling GPU work on a Kubernetes cluster, starting with emulated GPUs.
Comments