3 Industry usedone · reading only
6 Bare metaldone
Emulated BMCs·Rack power plan·Drift and burn-in·NetBox inventory·Hardening and Secure Boot·Network boot with PXE·RAID and management network
7 Cloud + GPUemulated done · real run pending
AWS autoscaling·GPU fleet monitoring·GPU scheduling·NUMA topology
Goal
Part 2 kept an nginx page running through node failures. A model server is a better test: each request costs real CPU, so latency changes with load, and scaling decisions matter. I wanted to see how a service like that behaves as load rises, how it scales, how an operator would watch it, and what the monitoring says when a node dies.
There are no GPUs in this lab. The model is small and runs on CPU, so the numbers describe this cluster and nothing larger.
Terms used in this post
These build on the Part 2 glossary.
- Model server: a program that loads a trained model and answers requests by running it. Here, an image classifier behind an HTTP endpoint.
- Inference: running a trained model on one input to get a result.
- Latency: how long one request takes, from sent to answered.
- Percentile (p50, p95, p99): the latency that 50%, 95% or 99% of requests were faster than. p99 is the slow tail.
- Throughput: requests completed per second.
- Concurrency: how many requests the client keeps in flight at once.
- Load test: sending traffic at a chosen concurrency to see how latency and errors change.
- Prometheus: a system that collects numbers (metrics) from services at a fixed interval and stores them as time series.
- Grafana: a dashboard tool that draws those time series.
- SLO (service level objective): a target such as “95% of requests answer in under 150 ms”.
- Alert rule: a query that Prometheus evaluates all the time. When it stays true for long enough, the alert fires.
- Readiness probe: a check Kubernetes runs against a pod. A pod that fails it is taken out of the Service.
- Cold start: the time from creating a pod to it answering requests.
What I built
Everything runs on the same three VMs. The model is MobileNetV2, an image classifier of 14 MB in the ONNX format. A short Python program loads it with ONNX Runtime and serves three paths: /predict runs one inference on a fixed random image, /healthz answers the readiness probe, and /metrics exposes request counts and a latency histogram in Prometheus format. Each request is one CPU thread of work.
The VMs are amd64 and I have no container registry, so I built the image with podman on another machine, saved it as a file, copied it to each node and imported it there. The Deployment runs it with a CPU request of 250m and a limit of one CPU, a readiness probe every two seconds, and a Service in front.
 Diagram: the pods, the load generator and the monitoring on the three nodes.
Prometheus and Grafana run on lab-node2, pinned there with a node label, and a node-exporter on every node reports machine CPU and memory. Prometheus finds the model-server pods through the Kubernetes API using an annotation on the pod. The load generator is a small script that keeps a fixed number of requests in flight. It runs as a Job on the control-plane node so it never competes with a serving node.
How it works
A request goes from the load generator to the Service address, then to one ready pod. The pod runs the model and answers, and records its latency in a histogram. Prometheus reads that histogram from each pod every 15 seconds.
Two things act on those numbers. A HorizontalPodAutoscaler watches the pods’ CPU use against their CPU request and changes the replica count. Alert rules watch the latency and the number of pods Prometheus can reach.
Commands and results
Startup and a single request. Two replicas were ready about three seconds after I applied the Deployment, with the image already on the nodes. A single request took about 9 ms. Each pod used 63 to 100 MB of memory.
Load test. I ran 20 seconds at each concurrency against two replicas.
| Concurrency | Requests per second | p50 (ms) | p95 (ms) | p99 (ms) | Failed |
|---|---|---|---|---|---|
| 1 | 107 | 9.3 | 10.0 | 11.1 | 0 |
| 2 | 187 | 10.2 | 12.8 | 25.8 | 0 |
| 4 | 189 | 13.9 | 57.7 | 66.0 | 0 |
| 8 | 191 | 33.2 | 84.1 | 92.0 | 0 |
| 16 | 187 | 45.3 | 92.9 | 1090 | 3 |
| 32 | 183 | 67.8 | 1060 | 3049 | 8 |
Throughput stopped growing at about 190 requests per second from a concurrency of two. After that, more concurrent requests only waited longer, and at 16 and 32 some requests hit the client’s five second timeout. During a separate run at concurrency 8, one pod used 903m of its one CPU limit and the other 526m, so the load was not even between them. Kubernetes enforces a CPU limit by throttling: when a container approaches its limit, the kernel restricts its access to the CPU (Kubernetes documentation). The pod at 903m was close to its limit, so the CPU limit is the likely ceiling here (my inference), and the pod at 526m shows the load was shared unevenly.
Autoscaling. The autoscaler had a minimum of two and a maximum of six replicas, with a target of 60% of the CPU request. I started it from idle with a sustained load at concurrency 16.
- At 21 seconds the CPU use was 143% of the request and the autoscaler asked for four replicas. Four were ready at 32 seconds.
- At 44 seconds it asked for six and six were ready. CPU use stayed at 281% to 329% of the request, so the maximum, not the target, was the limit.
- The first 20 seconds ran on two pods: 184 requests per second, p99 of 1082 ms and three failed requests. After that, six pods served about 350 requests per second with a p95 of about 96 ms, a p99 of 127 to 137 ms and no failures.
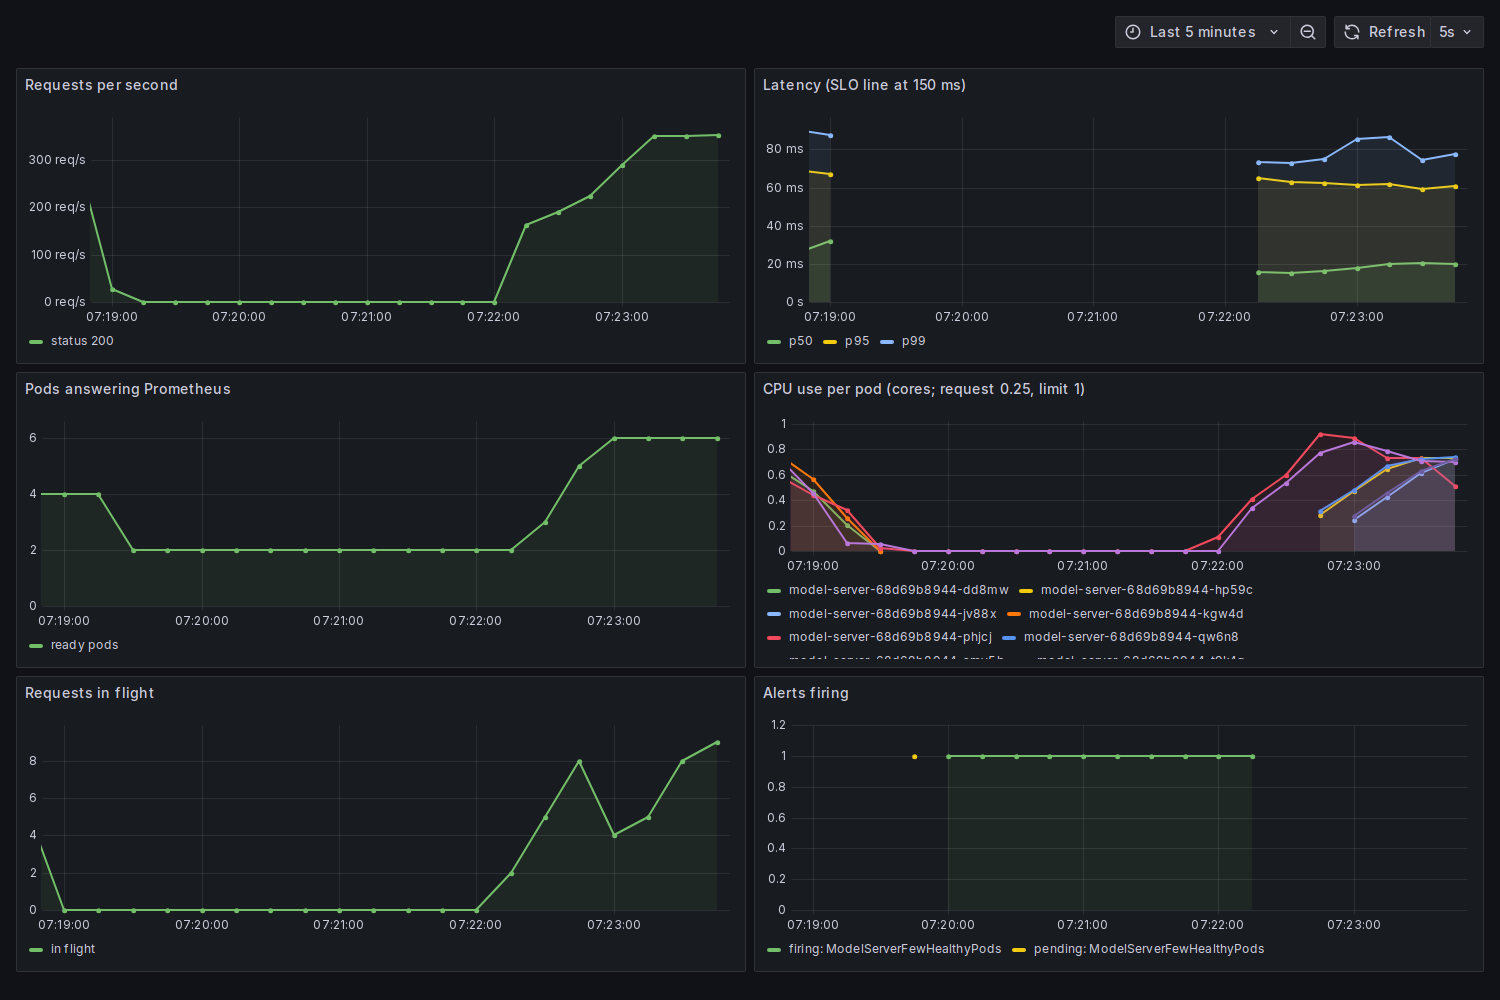 Screenshot: a second run of the autoscaling test with a Grafana dashboard open. Two pods sit idle, the load starts, and the pod count steps to four and then six while the request rate climbs to about 350 per second.
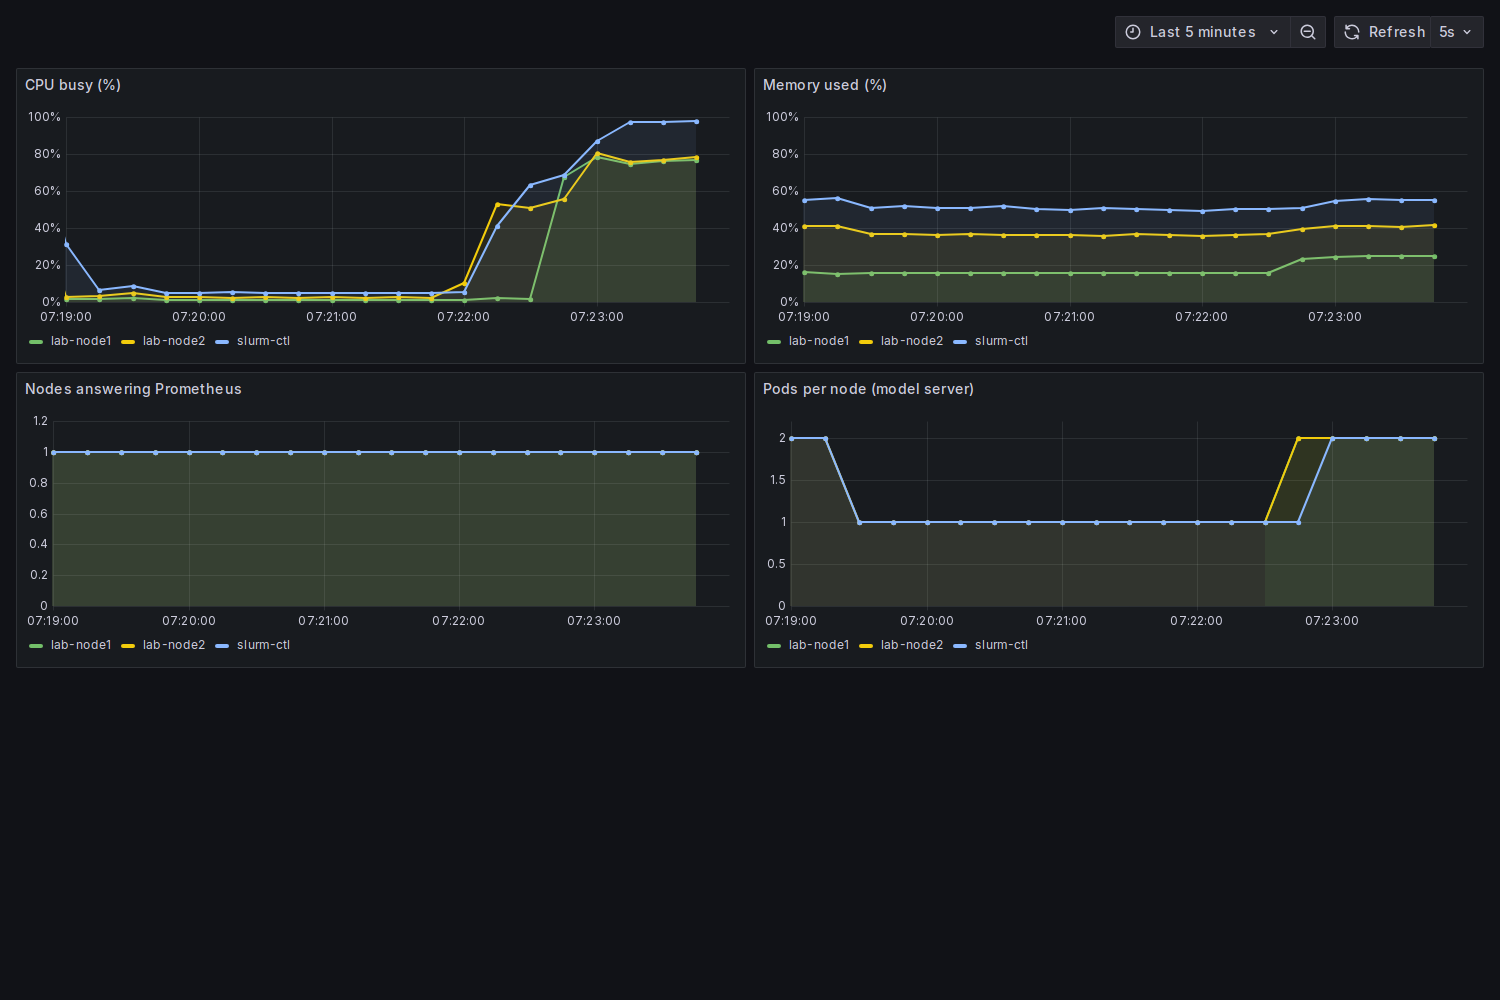 Screenshot: the node view for the same run. All three nodes reach 77% to 98% CPU busy at six pods, and the load generator runs on one of them.
Alert rules. I wrote two rules as a file in the repository and mounted them into Prometheus. One fires when the p95 latency is over 150 ms for 30 seconds. The other fires when fewer than three model-server pods answer Prometheus for 15 seconds. There is no Alertmanager, so I read the alert state from the Prometheus API.
A node powered off under load. I spread the pods over the nodes with a topology spread constraint, which put two on lab-node1. With four replicas under steady load at concurrency 8, I cut the power to lab-node1 from the hypervisor.
 Diagram: what the clients, the node and the alert showed during 168 seconds.
- The client saw its first failures about six seconds after the power-off. Requests that landed on the dead pods hung until the five second timeout, so the failures arrived in groups of eight, one for each worker.
- The pod-count alert went pending at 69 seconds and fired at 86 seconds.
- At about 90 seconds the node showed
NotReadyand the Service dropped to two ready endpoints. - Scattered failures continued at a lower rate until the end of the test at 168 seconds. A likely reason, which I did not measure, is the delay in routing rules. Elastic’s documentation says kube-proxy resynchronizes its rules every 30 seconds by default, and that during that window a terminating pod’s IP may still be used when targeting the Service.
- In total, 156 of 23,406 requests failed (0.67%). The latency alert never fired.
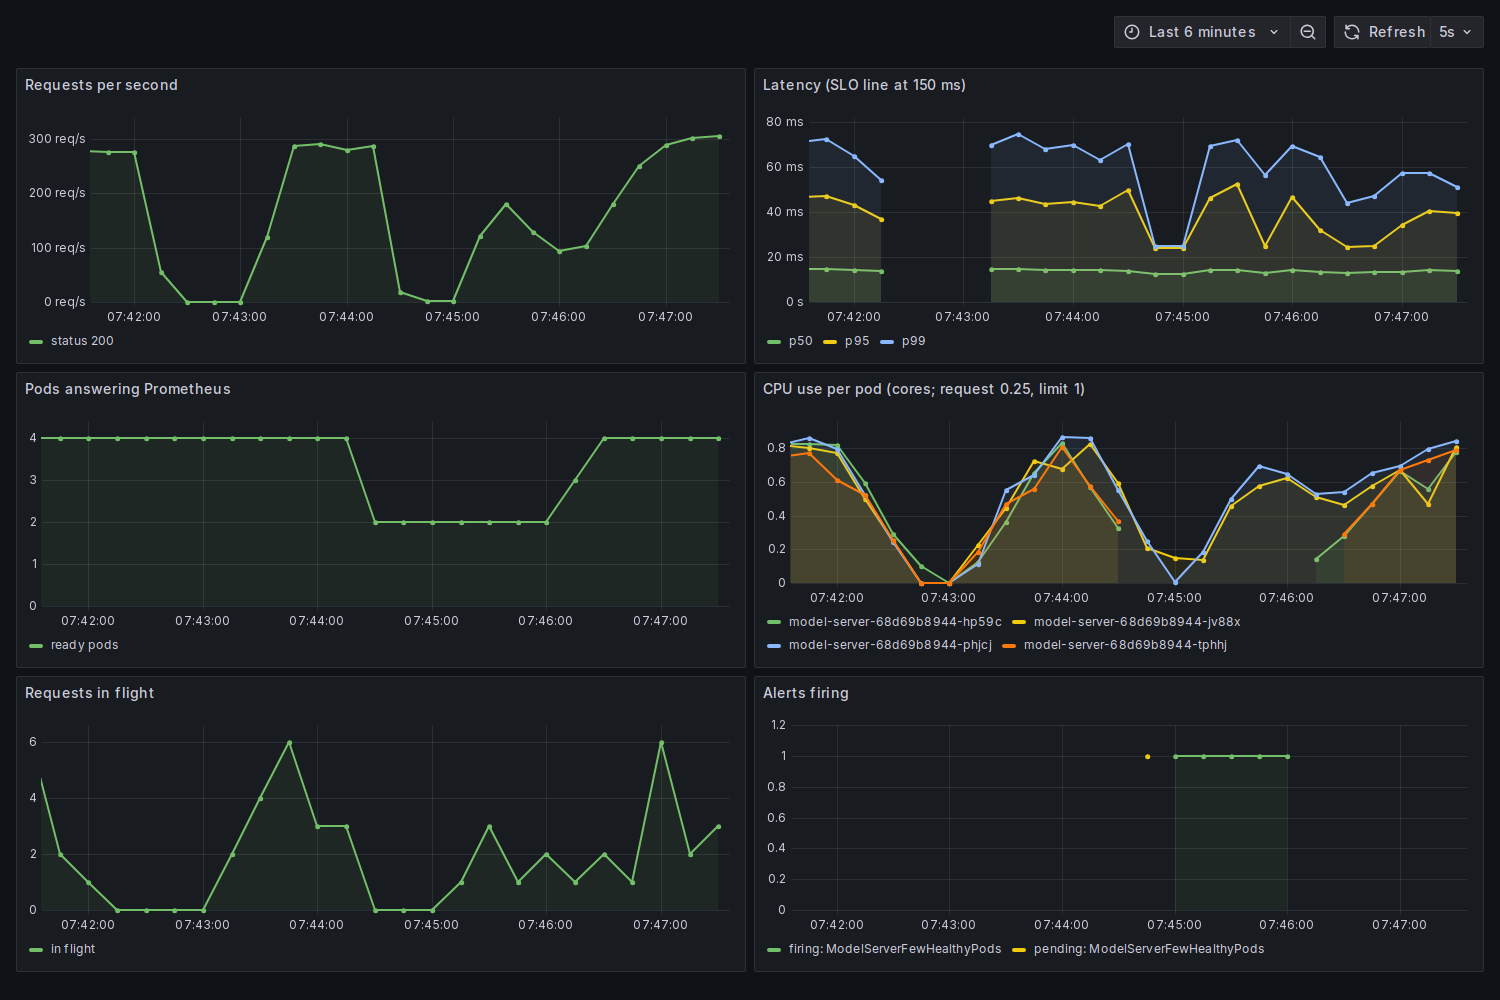 Screenshot: a second run of the power-off with the dashboard open. The request rate falls to about zero for roughly half a minute, the pod count drops from four to two, the pod-count alert fires and clears after the node returns, and the latency panel stays below the 150 ms line.
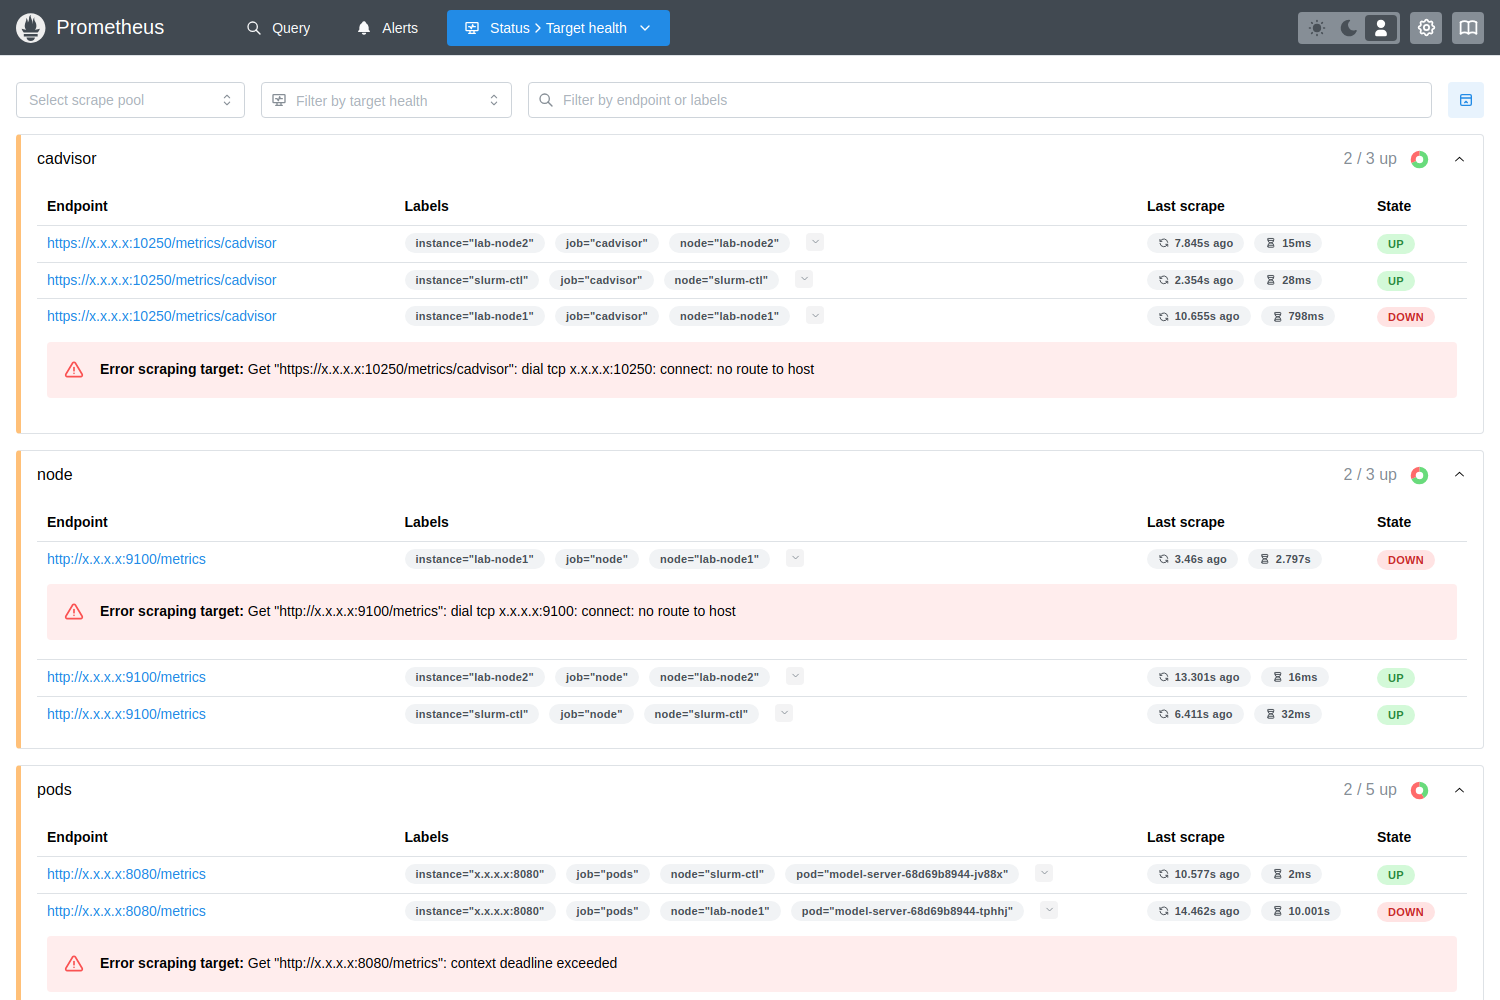 Screenshot: the Prometheus target page during that run. The targets on the powered-off node report DOWN. Addresses are masked.
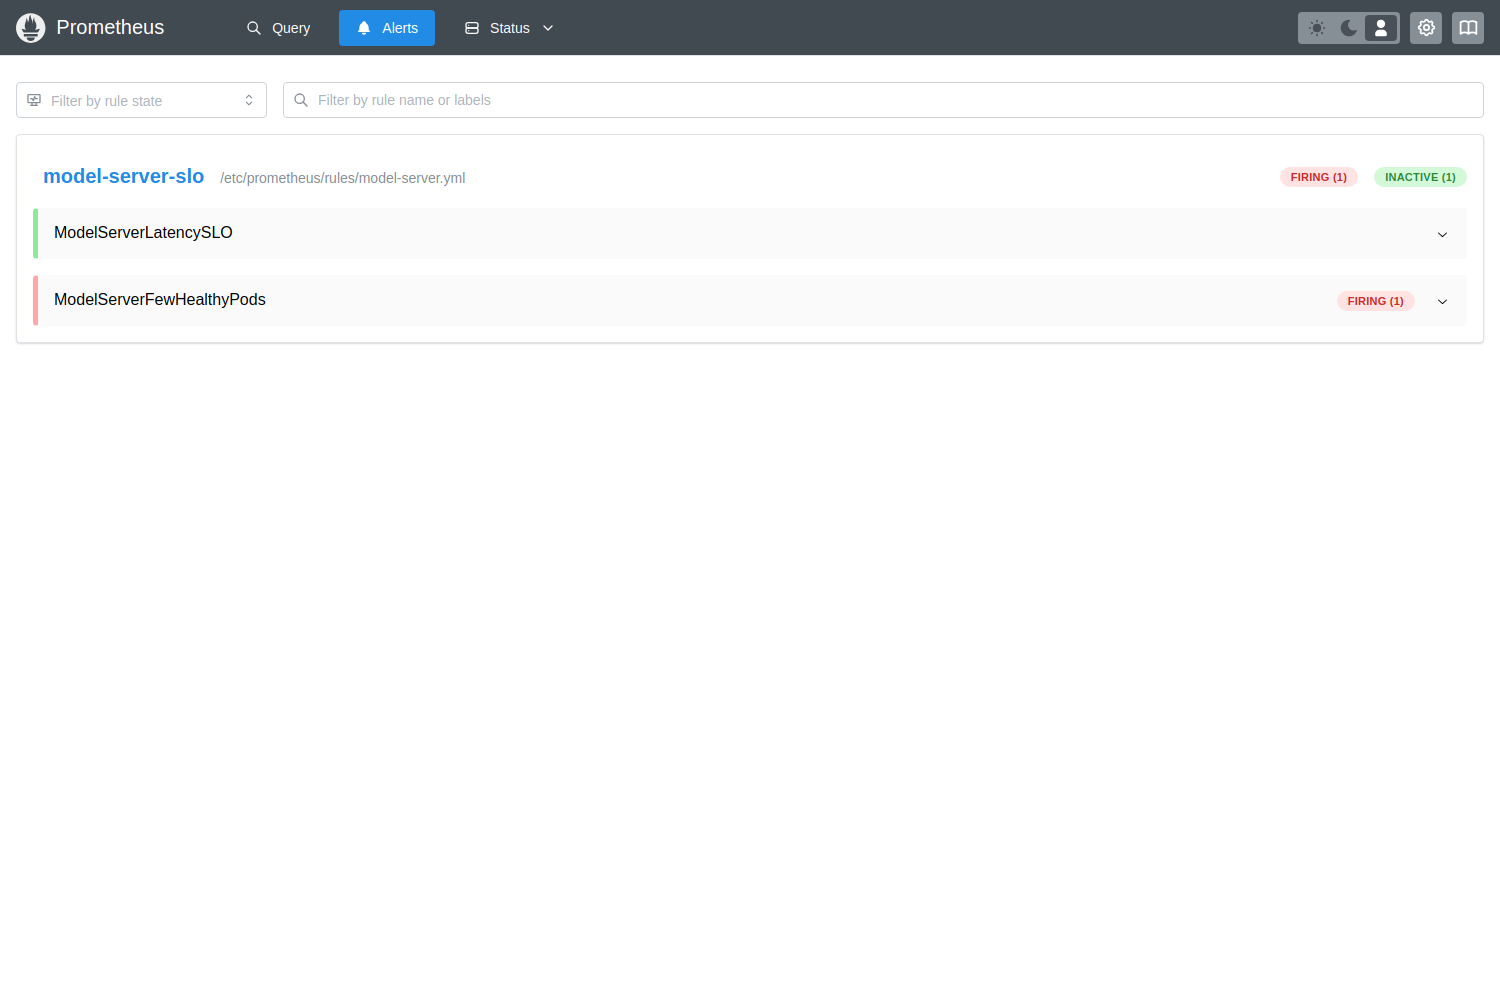 Screenshot: the alerts page during that run. The pod-count rule is firing and the latency rule is inactive.
Challenges
- A node that came back wrong after a power loss. When I started
lab-node1again, Slurm kept itDOWNand a job on it failed. The node could not resolve the controller’s name. The hypervisor generates cloud-init data for each VM with a setting that rewrites/etc/hostsat boot, and that setting overrode the file I had added to switch it off in Part 1. The fix had only lasted until the first power cycle. I disabled cloud-init on the nodes in the Ansible role and checked it through another power cycle. In a fleet this is the gap between a configuration that was applied and one that survives a reboot after a power event. - Server-side metrics did not see the outage. The failed requests never reached a server, so the latency alert stayed quiet while clients were timing out. The alert on the number of reachable pods caught it, but only about 48 seconds after the power-off. Alerts need a view from outside the service as well as from inside.
- Where the pods are decides the blast radius. My first power-off test hit nothing, because none of the pods happened to be on that node. Without a spread constraint the scheduler had put them elsewhere. Only after I spread them did the test mean anything, and the failure rate of a node loss depended on how many pods it held.
- Uneven load across pods. Connections are balanced by the Service when they are opened, and a client that reuses a connection stays on one pod. One pod ran near its CPU limit while its neighbour had room.
- An autoscaler that reacts to old data. The first time I applied the autoscaler, it scaled up straight away because the CPU figures from my previous load test were still in its metrics window. A clean scale-up measurement needed the cluster to go idle first.
What this lab cannot show is traffic from real users, a model that takes seconds per request, or a service whose load changes over days.
Differences with a production model-serving setup
This is four small pods on three VMs, so the numbers describe this lab. The load generator and the servers share the same host, and the network between them is virtual.
- Metrics. I took the numbers in the tables from the load tool and from Prometheus queries. I built the Grafana dashboards in the screenshots afterwards, as code, and used them for a second run of the autoscaling and power-off tests. I did not set up a long-term store for the metrics, so history is lost when Prometheus restarts.
- Alerting. A real setup sends alerts through Alertmanager, which groups and routes them. I did not set it up. Latency percentiles from a histogram are estimates from buckets, so bucket choice affects them.
- Objectives. I picked 150 ms by looking at the data. A real service level objective comes from what users need and has an error budget attached.
- Scaling. I used CPU, with a HorizontalPodAutoscaler that has no knowledge of queue depth or latency. I did not tune its behaviour settings.
- Failure handling. I used the default readiness probe timing and the default node failure timers. I did not test shorter settings or client retries, so I cannot say how much of the 0.67% they would remove.
- Placement. I used one topology spread constraint across nodes. Production clusters spread across racks and zones as well.
- Model and hardware. A 14 MB image classifier on CPU says nothing about GPU inference, large language models or batching.
- Serving platform. I wrote a small server by hand. Production setups often use a serving layer such as KServe for routing, model versions and scaling of model endpoints.
- Event-driven scaling. KEDA can scale a workload on a queue length or a Prometheus query, which is closer to what a model server needs than CPU alone. I did not use it.
- Node provisioning. My three nodes are fixed. Tools such as Karpenter add and remove nodes as pods need them, which matters most when the nodes are expensive GPU machines.
FAQ
What is ONNX?
A file format for trained models, so a model made in one framework can be run by another runtime. Here ONNX Runtime runs it on the CPU.
Why use p95 and p99 and not the average?
An average hides the slow requests. A few slow ones can be a large share of what users feel. At concurrency 16 the p95 was 93 ms while the p99 was over a second.
What is a closed-loop load test?
Each simulated user sends a request, waits for the answer, then sends the next. The load adjusts to how fast the server answers. The alternative is to send requests at a fixed rate regardless of the answers, which shows overload more sharply.
Why did the Service keep sending requests to a powered-off node?
For about 50 seconds after the power-off the control plane still believed the node was Ready. Only when it was marked NotReady did its pods leave the Service’s ready endpoints.
Next
Take the quiz to test your understanding: Part 4 quiz
Part 4 continues: measuring how fast data reaches the model server from local disk, from NFS and from object storage.
Comments