Goal
The earlier Part 6 posts each had a list of machines in a script or a table. In a real data center that list is a system of its own, an inventory of what is in each rack, how it is powered, how it is cabled and how to reach its management controller. Tools that do this are called data center infrastructure management (DCIM) tools. The open source one that most people meet first is NetBox.
I wanted to put the example rack from the power plan into NetBox and see what an inventory is good for once it exists. Can it reproduce the power numbers? Can a script tell where the inventory and the controllers disagree? Can a machine be added and removed in a way that leaves a record? This is an exercise with emulation and an example rack, so it shows the method and not the effort of keeping a real inventory right.
Terms used in this post
- DCIM: data center infrastructure management, the inventory and planning of racks, devices, power, cabling and space.
- Source of truth: the one place that other tools and people trust for what exists and how it is connected.
- Device type and role: a device type is a model with its size and ports, and a role says what a device is for, such as GPU node or PDU.
- Power feed, port and outlet: a feed is a circuit coming into the room, a port is where a device takes power, and an outlet is where a PDU gives it out.
- Cable: a recorded connection between two ports, here from a server’s power supply to a PDU outlet.
- Allocated draw and maximum draw: the typical and the peak power a port is expected to use.
- Out-of-band (OOB): reaching a machine through its management controller and not through its operating system.
- Reconcile: comparing two records of the same thing and listing where they differ.
- Journal entry: a note attached to an object in NetBox, with a time and a user.
- Decommissioning: the status of a device that is being taken out of service.
What I built
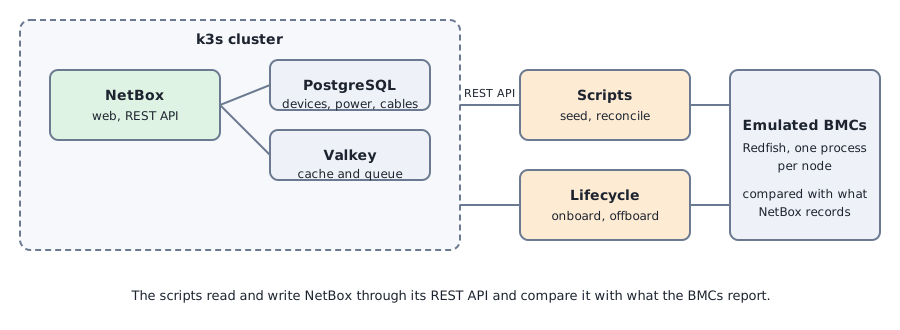
- NetBox 4.7.4 on the cluster. The web application, a PostgreSQL database and a Valkey cache, running in their own namespace. The database has a small persistent volume, and the secrets are generated at deploy time and kept out of the repository.
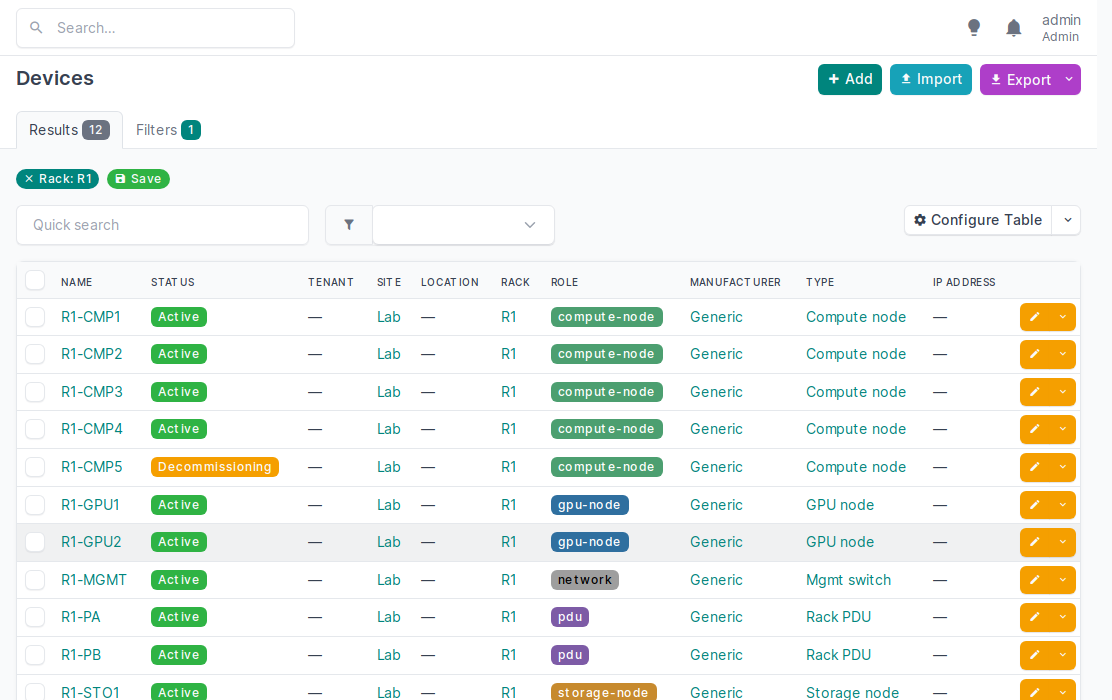
- The rack in NetBox. One site and rack, two power feeds, two PDUs with 24 outlets each, and the nine devices from the power plan with their positions, power supplies and cables, matching the outlet map. The six servers that have a BMC carry a record of which emulated controller is theirs.
- A cross-check script. It compares NetBox with the emulated BMC fleet and recomputes the power plan from NetBox’s own numbers.
- An onboarding and offboarding script. It adds or removes a node in NetBox and on its controller together, with a power check before anything is activated.
How it works
NetBox models the power chain as connected objects. A power feed is cabled to a PDU’s input port, the PDU has outlets that belong to that input, and each server’s two power supplies are cabled to outlets, one on each PDU. Every port can carry an allocated draw and a maximum draw. NetBox adds up the allocated draw of everything below a feed and compares it with the feed’s available power, so a feed page shows how full the circuit is. The sum only works if the PDU’s input port has no draw of its own, because a number entered by hand replaces the roll-up.
I put the typical and peak watts of the power plan on each power supply, half on each, which is how the plan loaded each side. NetBox shows the typical total against the volt-amps the feed can carry. The script uses the peak total and compares it with the continuous limit in watts, as the plan did. They answer different questions: how full the circuit usually is, and whether it survives the worst case.
For the controllers, each server has a management interface with an address and a custom field with its BMC endpoint. The reconcile script reads the devices through the REST API and asks each recorded endpoint for a Redfish system record. It flags a device that should have a controller and has none recorded, a recorded controller that does not answer, and a controller that answers but belongs to no device.
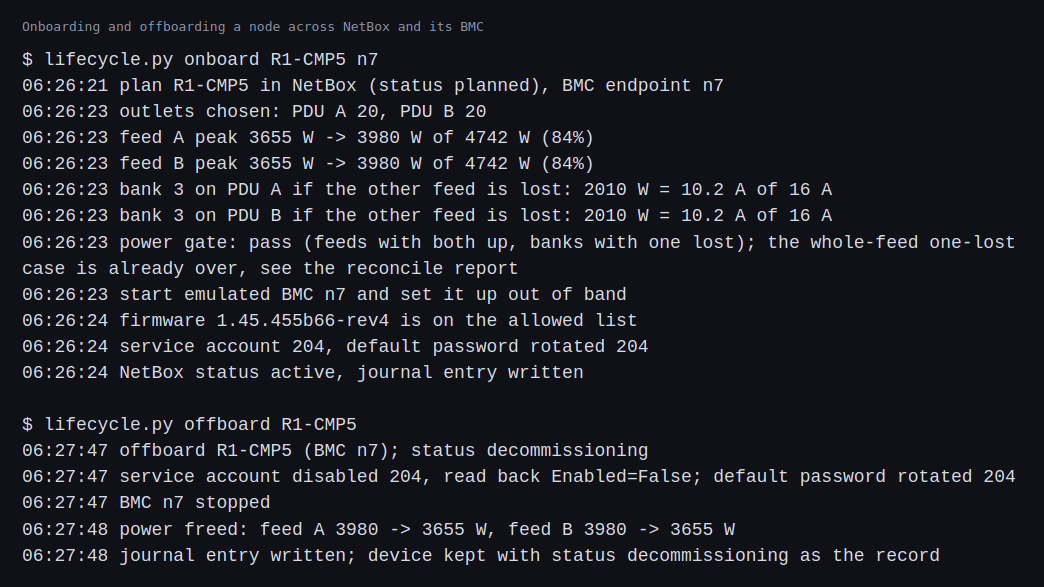
Onboarding follows an order a real process would. The device is created in NetBox as planned, with its power supplies cabled to free outlets. A power check runs before anything else happens, with both feeds up and with the chosen bank’s load if the other feed were lost. Then the controller is set up out of band: the firmware version is checked against an allowed list, a service account is created and the default password is rotated. Only then does NetBox move the device to active and write a journal entry. Offboarding does the reverse and keeps the device as a record.
Commands and results
NetBox came up in a few minutes after I gave its container enough memory for the first start. At rest, the application uses about 1.4 GiB, the database about 110 MiB and the cache under 10 MiB, which is a lot for the node it runs on and worth knowing before putting it on a small machine.
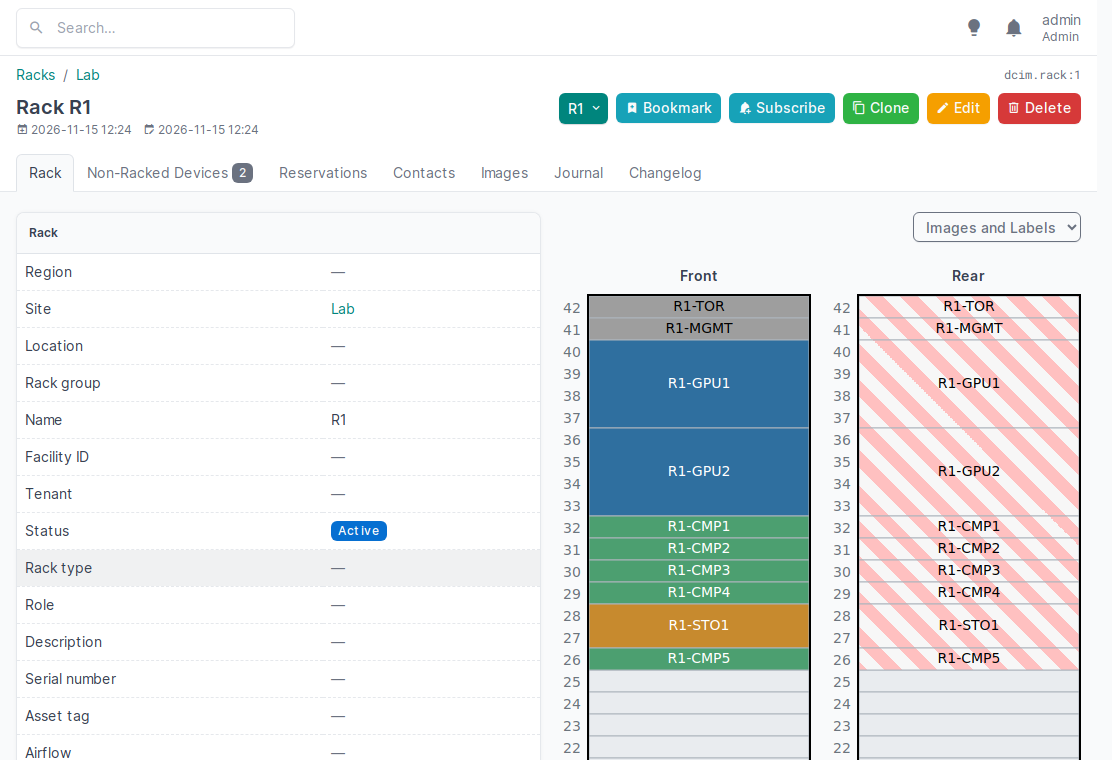
The rack page shows the front and rear views with the devices in their positions, which is what a person at the rack wants to see.
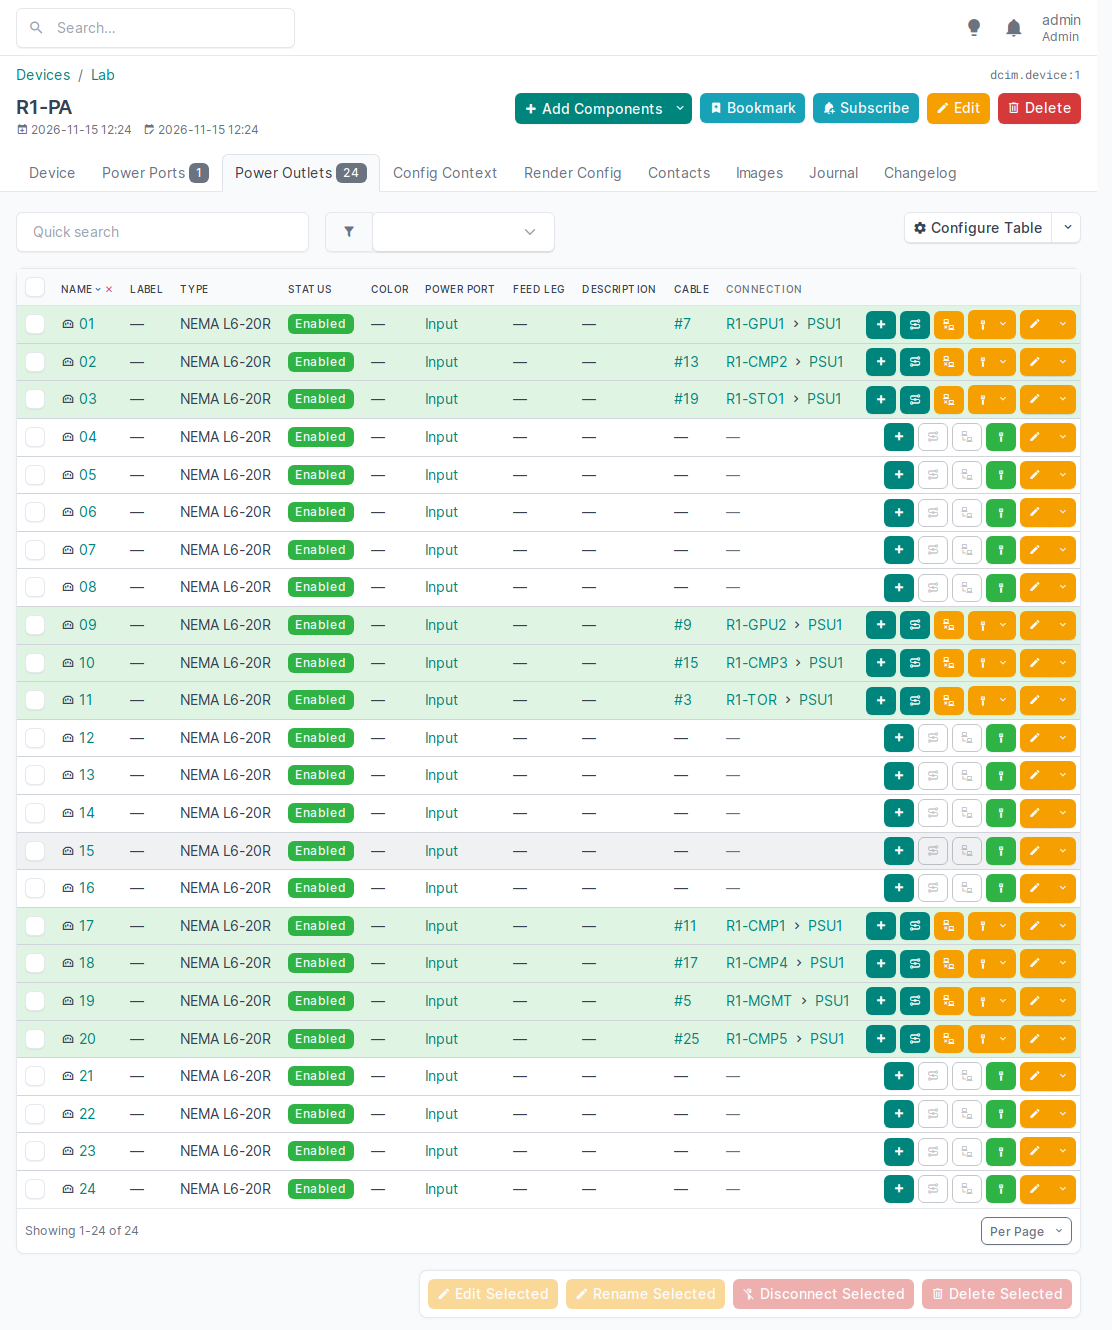
The outlet page of PDU A is the outlet map from the power plan, now as data. Outlet 01 is the first GPU node’s first supply, 02 and 03 are a compute node and the storage node, and so on. The same labels as in the plan are used.
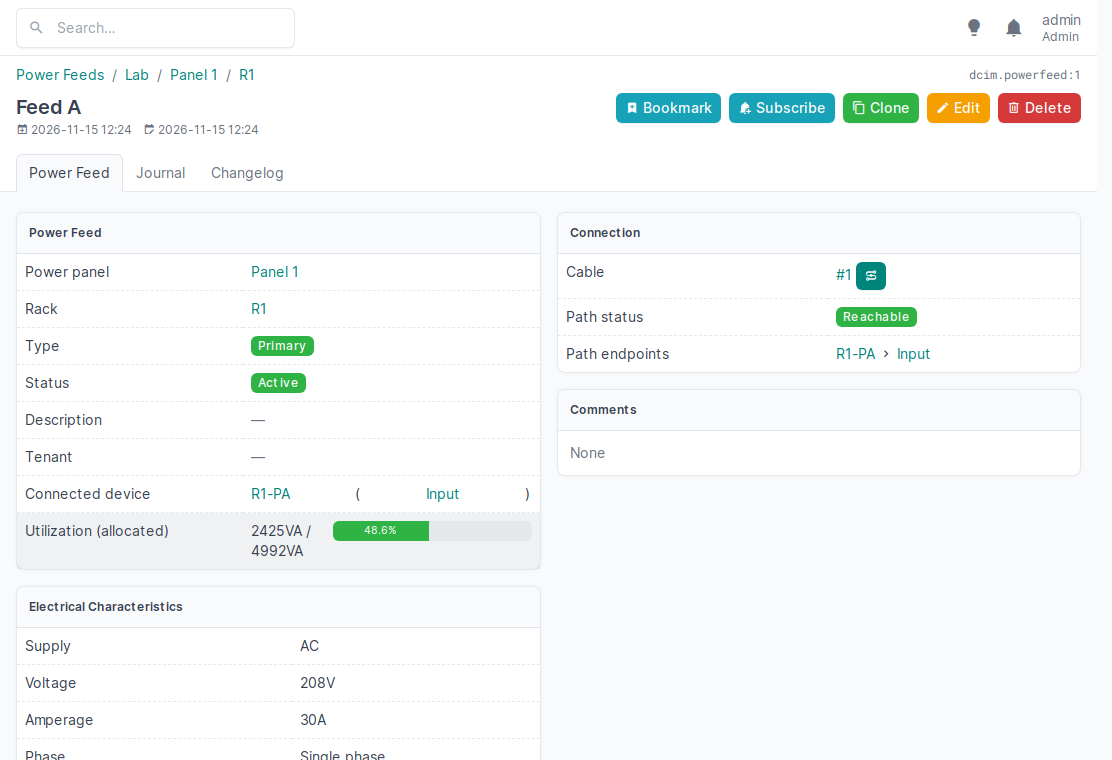
The feed page shows the roll-up. With a fifth compute node onboarded, feed A carries 2,425 VA of allocated draw out of the 4,992 VA it can supply, 48.6 percent. That is the typical draw, not the peak.
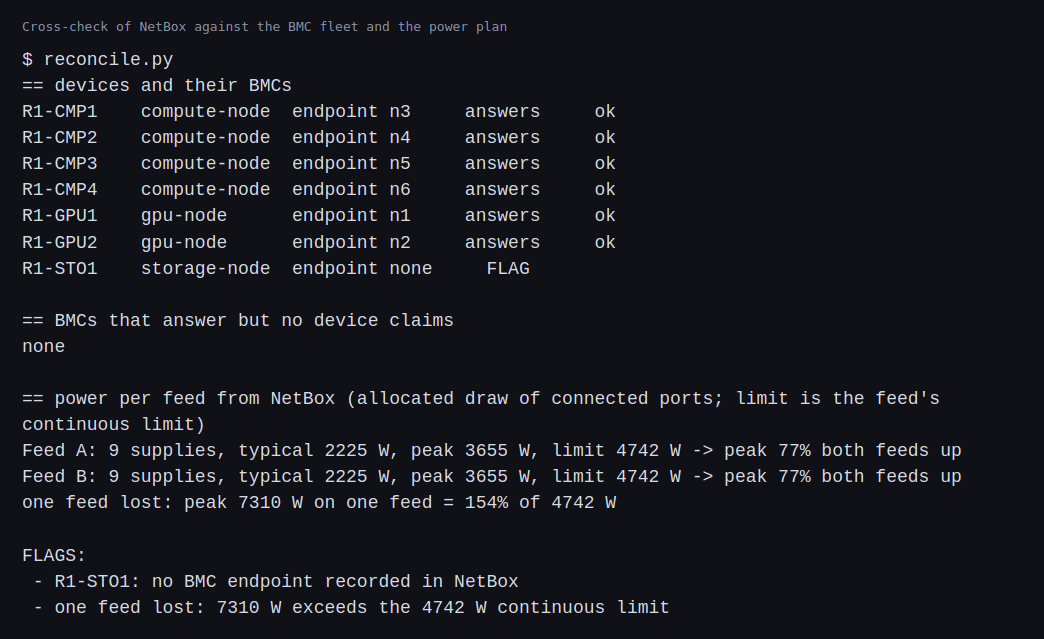
The cross-check reproduced the power plan from the inventory. Both feeds at peak come to 3,655 watts, 77 percent of the limit, and with one feed lost 7,310 watts on the other, 154 percent. These are the same results the script of the power plan gave from its own table. The check also flagged the storage node, which has no BMC recorded because I had not emulated one for it.
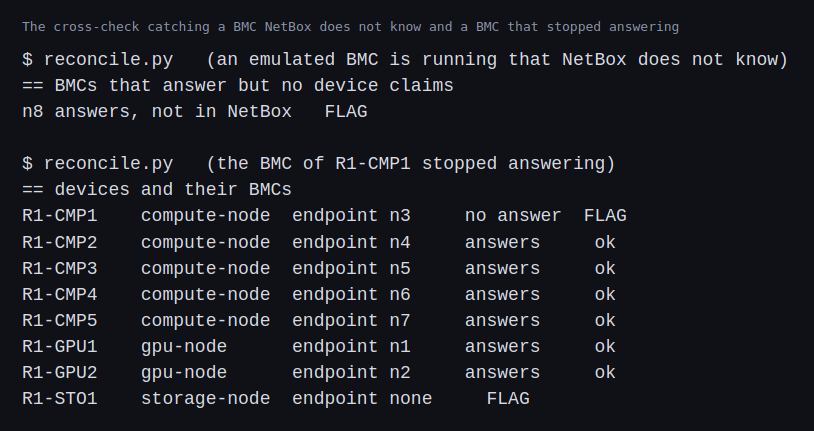
Two more cases show the check finding disagreements. I started an emulated BMC that NetBox did not know about, and it was flagged as answering with no device. I stopped the BMC of one compute node, and the report flagged that device because its recorded endpoint no longer answered.
The lifecycle run onboarded a fifth compute node. The script chose outlet 20 on each PDU, in the third bank, which was the bank that would carry the least if one feed were lost, at 10.2 amps against a 16 amp limit. With both feeds up, each would then be at 84 percent of the limit. The controller was started, its firmware version passed the allowed list, the service account was created and the default password rotated. Offboarding disabled the service account and read it back, rotated the password, stopped the controller and removed the power cables, which brought each feed back to 3,655 watts.
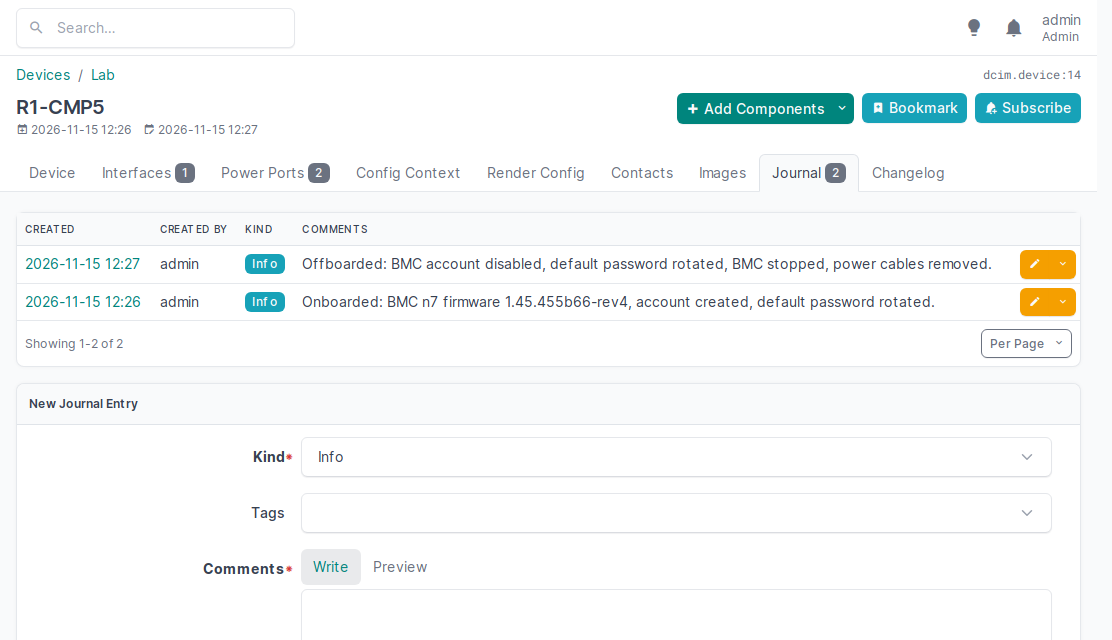
The two steps left journal entries on the device, and the device stayed in the list with the status decommissioning as the record.
Challenges
- The inventory and the machines disagree in both directions. In three drills the check found a device with no controller recorded, a controller with no device, and a recorded controller that did not answer. Each is a different failure of process: something was never recorded, something was installed without being recorded, or something broke. A reconcile only helps if someone acts on the list.
- Two numbers for power answer two questions. NetBox showed 48.6 percent for typical draw while the check showed 77 percent at peak with both feeds up and 154 percent with one lost. Reporting only the first would have hidden the problem the power plan found.
- The check flags the lost-feed case and does nothing about it. I gated onboarding on the both-feeds-up numbers and the bank load if a feed were lost, but the whole-rack case is already over the limit and stays flagged. Whether to allow more load on a rack that cannot survive a feed loss is a decision for a person.
- Placing a node is a power decision. A free outlet is not enough. One bank was already near its limit for the feed-loss case, so the script picks the bank by what it would carry in that case and not by which outlet is next.
- Inventory goes stale unless every change goes through it. The scripts update NetBox and the controller together, which keeps them in step for these drills. A node moved by hand, or a cable swapped without a record, would not be seen.
- An inventory needs resources and care. The application used far more memory than the database it sits on, and it needs backups, upgrades and access control like any other service.
Differences with a production setup
- Scale and availability. A production NetBox runs as several replicas with a managed database, backups and single sign-on. The community maintains a Helm chart for the Kubernetes case. I ran one of everything.
- Data entry. Real inventories are filled by scanning asset tags, importing from vendors’ shipping lists and discovery tools, not by a seed script. Mine had nine devices.
- Integration. A source of truth is useful when other tools read it. The Ansible NetBox collection builds an inventory from NetBox, and provisioning and monitoring tools can do the same. I used the REST API from my own scripts.
- Other tools. Commercial DCIM products add features such as real-time power and cooling monitoring, floor plans and capacity forecasting. I have only worked with NetBox here, and its documentation covers what it does.
- Real power data. Production feeds use metered PDUs, so the inventory holds measured draw next to the allocated numbers. Mine had only assumptions.
- Process. A real change goes through a ticket, a review and a scheduled window. Mine was a script.
FAQ
What is a DCIM tool for?
It keeps track of what is in the data center and how it is connected: racks, devices, power, network cables and addresses. People use it to plan capacity and to find out what a change will touch.
Why call it a source of truth?
Other tools take their device lists from it, so a change in one place flows to the rest. The value is that there is one list to keep right.
Why record a BMC endpoint in the inventory?
Tools that manage machines out of band need to know where each controller is. Keeping it with the device means the link between a machine and its controller is not held in someone’s head.
Why keep a decommissioned device in the inventory?
It leaves a record of what was there, when it left and what was done, which helps with audits and with questions about old incidents. The cables are removed so that the outlets and the power are free.
Why does NetBox show 48.6 percent when the check says 77 percent?
NetBox showed the typical draw of the devices against what the feed can supply, and the check used the peak. The typical figure says how full the circuit usually is, and the peak says what happens at the worst time.
What will change the most between this inventory and a real one?
How the data stays correct. Here one rack was entered once and compared with an emulation. In a real room many people change things, so the work moves from entering data to finding where the inventory and the room have drifted apart.
Repeating with real hardware
Coming soon. When I have real servers, I will enter the rack with real serial numbers, asset tags, cable labels and BMC addresses, run the same cross-check against the real controllers, and onboard and offboard a real machine.
Next
Take the quiz to test your understanding: Part 6 quiz
Part 6 continues with hardening a machine and securing how it boots.
Comments